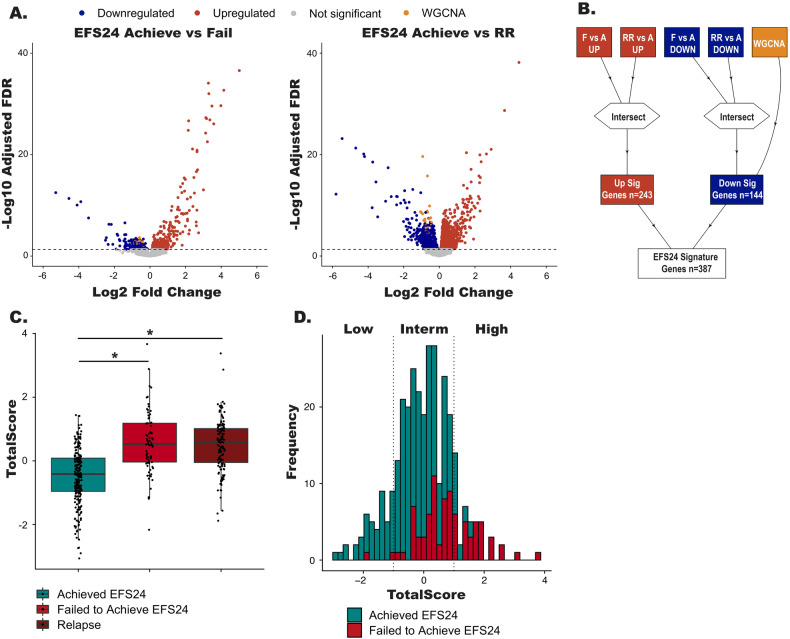
Fig. 3. Generation of the RNA risk signatures.
A Volcano plots showing differentially expressed genes (FDR < 0.05) between EFS24 achieve vs fail or EFS24 achieve vs rrDLBCL cases. Red dots represent upregulated genes, blue dots represent downregulated genes, gold dots represent genes identified in the WGCNA analysis, and gray dots are non-significant genes. B Schematic representation of how the 387 gene risk signature was generated. C Boxplots TotalScores for the risk signature foreach patient. *P < 0.05. D Distribution of the scaled Totalscores. Vertical lines represent +/- standard deviation which groups the scaled Totalscores samples into high, low and intermediated risk cases.

