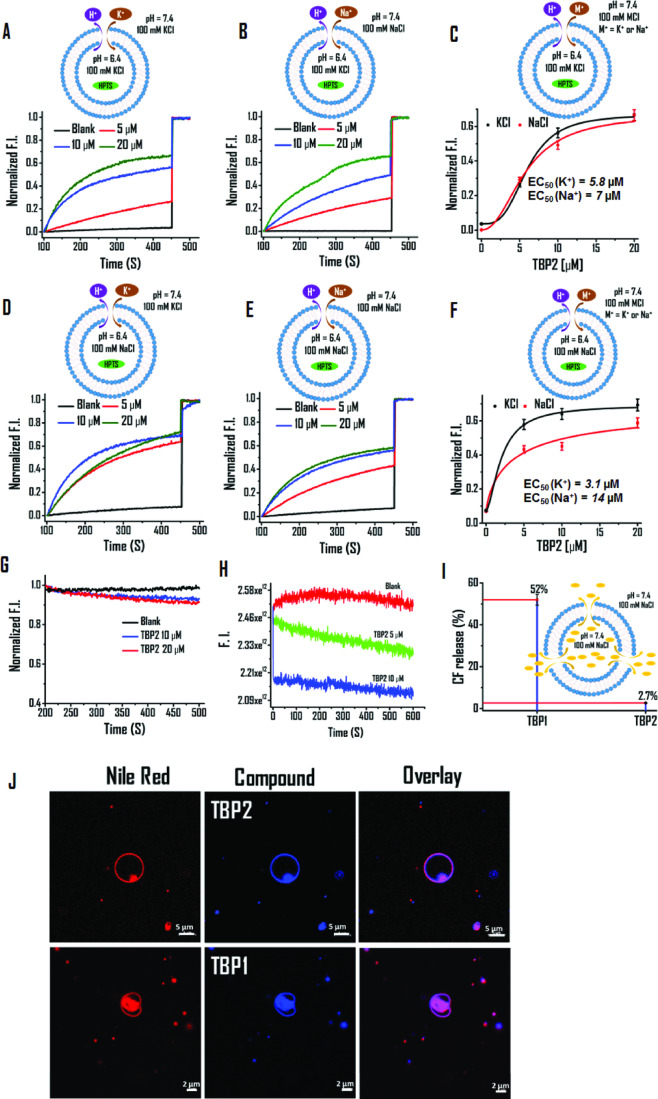
Fig. 3. TBP2 gated ion transport via model lipid bilayer.
A–F HPTS assay for measuring the ion transport activity of TBP2 in the presence of Na+ and K+ ions. Buffer composition: Internal – (A, B) 10 mM HEPES 100 mM KCl (pH 6.4), (D, E) 10 mM HEPES 100 mM NaCl (pH 6.4), External – (A, E) 10 mM HEPES 100 mM KCl (pH 7.4), (B, D) 10 mM HEPES 100 mM NaCl (pH 7.4). C EC50 value determination of TBP2 in the presence of external buffer – 10 mM HEPES 100 mM NaCl or KCl (pH 7.4), internal buffer – 10 mM HEPES 100 mM KCl (pH 6.4). Data are presented as means ± SD (n = 3). Source data are available. F EC50 value determination of TBP2 in the presence of external buffer – 10 mM HEPES 100 mM NaCl or KCl (pH 7.4), internal buffer – 10 mM HEPES 100 mM NaCl (pH 6.4). Data are represented as means ± SD (n = 3). Source data are available. G Lucigenin assay of TBP2 for Cl- transport. Change in fluorescence intensity as a function of time in 225 mM NaNO3 buffer. H Safranin O assay for membrane polarization in the presence of HEPES-NaCl (external) and HEPES-KCl (internal) buffers. I CF release assay; determination of CF release percentage in the presence of TBP1 and TBP2 (External: 10 mM HEPES 100 mM NaCl, pH 7.4; Internal: 10 mM HEPES 100 mM NaCl, pH 7.4) after 8 minutes. Error bars represent ± SEM (n = 3) (J) Membrane colocalization of TBP1 and TBP2 in GUVs. Scale bars represent 5 µM (top row) and 2 µM (bottom row). The imaging experiments were performed independently at least three times (n = 3). HPTS, 8-hydroxypyrene-1, 3, 6-trisulfonic acid trisodium salt; CF Carboxyfluorescein, LUVs large unilamellar vesicles, GUVs giant unilamellar vesicles.

