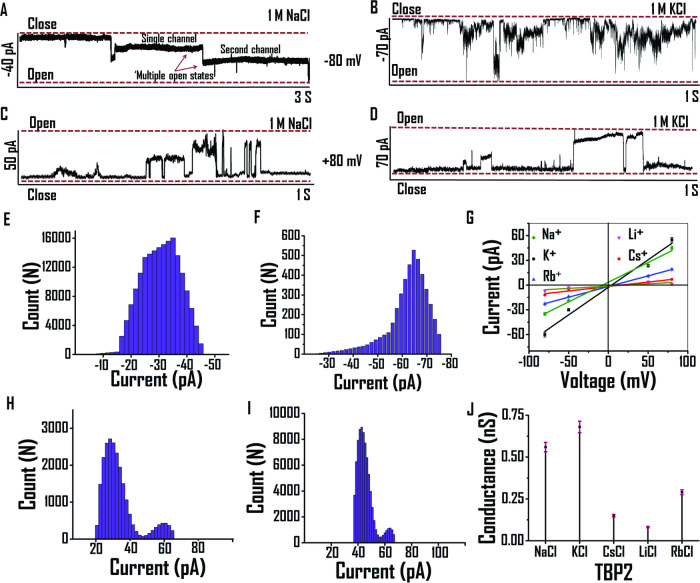
Fig. 4. Ionic conductance measurements via patch clamp studies.
Current measurement in the presence of 1 M NaCl at (A) −80 mV, (C) + 80 mV or 1 M KCl at (B) −80 mV and (D) + 80 mV, respectively. Bar diagram for frequency vs current of TBP2 in the presence of 1 M NaCl at (E) −80 mV, (H) + 80 mV or 1 M KCl at (F) −80 mV, (I) + 80 mV. G I-V plot of TBP2 in the presence of 1 M MCl [M = Na+, K+, Cs+, Li+, Rb+] buffers (pH 7). Data are represented as means ± SD (n = 3) (J) Drop line plot of conductance of TBP2 in the presence of different metal ions. Data are represented as means ± SD (n = 3).

