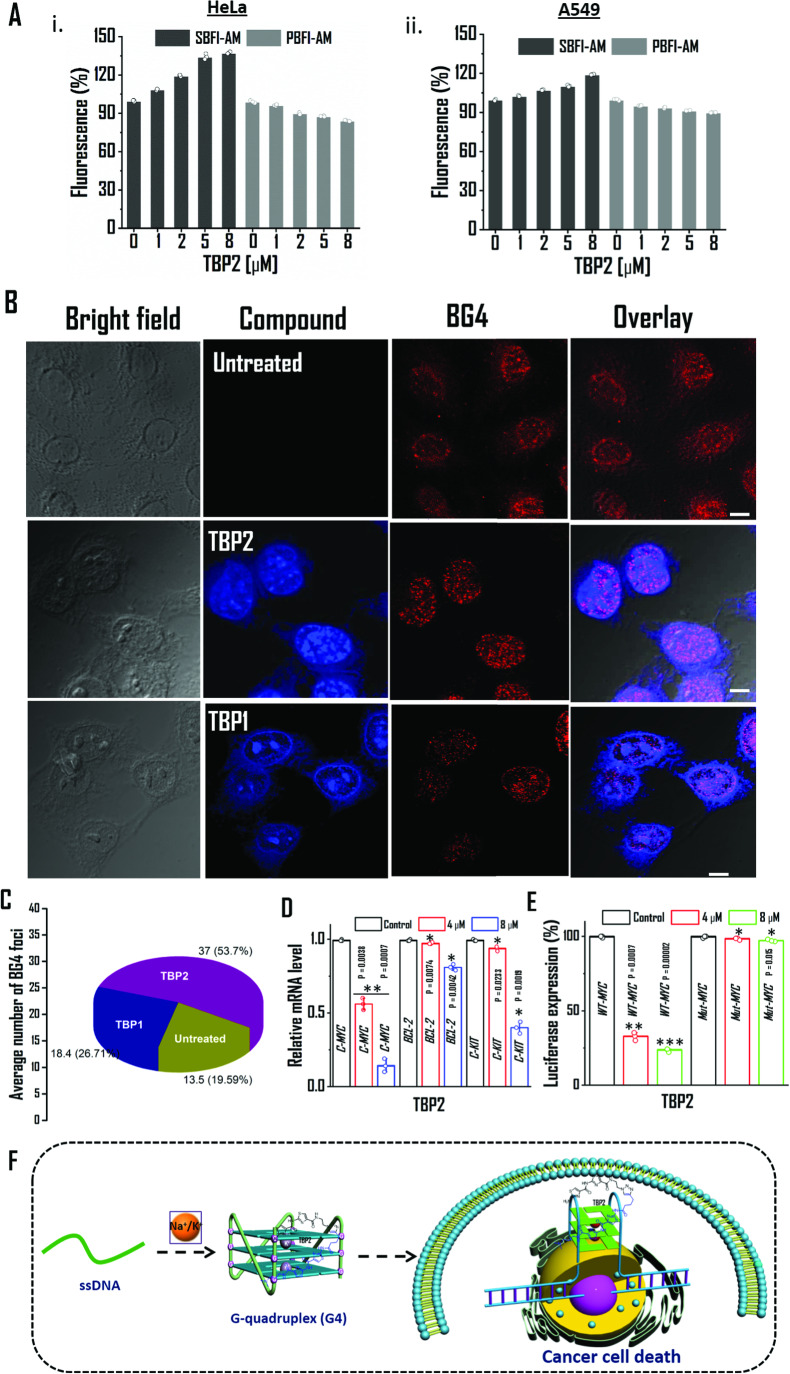
Fig. 6. Intracellular activity of TBP2 in cancer cells.
A TBP2 dependent intracellular fluorescence intensity measurements of Sodium-binding benzofuran isophthalate acetoxymethyl ester (SBFI-AM, Na+ probe) and Potassium-binding benzofuran isophthalate acetoxymethyl ester (PBFI-AM, K+ probe) in (i) HeLa and (ii) A549 cells. Error bars represent mean ± SD (n = 3). B Confocal images of HeLa cell (fixed) stained with TBP2 (blue) and BG4 (red); scale bars represent 10 µM. C Determining the average number of BG4 foci in untreated and ligand treated HeLa cells after 24 h. At least five independent fields were considered to quantify the BG4 foci. D qRT-PCR analysis for transcriptional regulation of c-MYC, BCL-2, c-KIT oncogene after treatment with TBP2 in HeLa cells for 24 h. Quantification was done in terms of fold change by double delta CT method using 18 s rRNA as a housekeeping gene. Fold change of ligand treated relative gene expression is normalized with control. Error bars represent mean ± SD (n = 3). **P = 0.0038, 0.0007 and *P = 0.0074, 0.0042, 0.0233, 0.0019; as obtained using paired sample statistical analysis (Student’s t test), versus untreated or control HeLa cells. E Relative luciferase expression of c-MYC promoter normalized with the Renilla plasmid pRL-TK after treatment with TBP2 at two different doses for 48 h. Percentage change of ligand treated relative luciferase expression is normalized with control. Error bars stand for mean ± SD (n = 3). **P = 0.0007, ***P = 0.00002; as obtained using paired sample statistical analysis (Student’s t test), versus untreated or control HeLa cells.; F Schematic illustration of TBP2-G4 interaction to mediate cancer cell death. G4; G-quadruplex.

