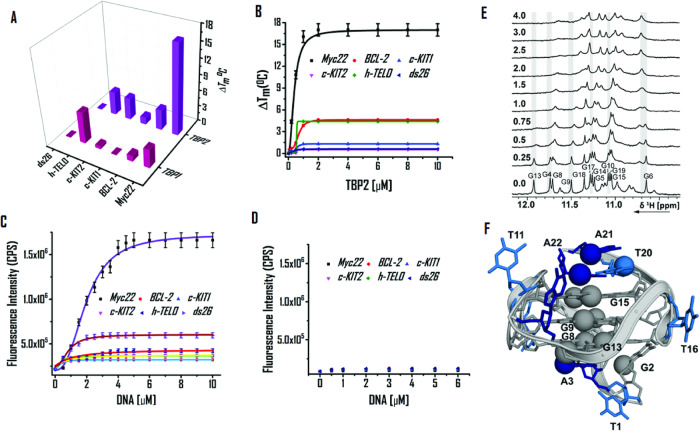
Fig. 7. DNA binding properties of TBP2.
A 3D bar diagram of FRET based melting experiments to determine stabilization potenetial (ΔTM) of TBP1 and TBP2 for G4s and ds26 DNA. B FRET titration of TBP2 with G4s and ds26 DNA in 60 mM potassium cacodylate buffer (pH 7.4); Error bars represent mean ± SD (n = 3). Fluorescence titration of (C) TBP2 and (D) TBP1 in 60 mM potassium cacodylate buffer (pH 7.4); Error bars stand for mean ± SD (n = 3). 1D 1H NMR spectra of the (E) imino region of c-MYC22 in 25 mM Tris∙HCl buffer containing 100 mM KCl at different [TBP2:DNA] molar ratios. F NMR-structure of c-MYC22 (pdb-code: 1XAV).

