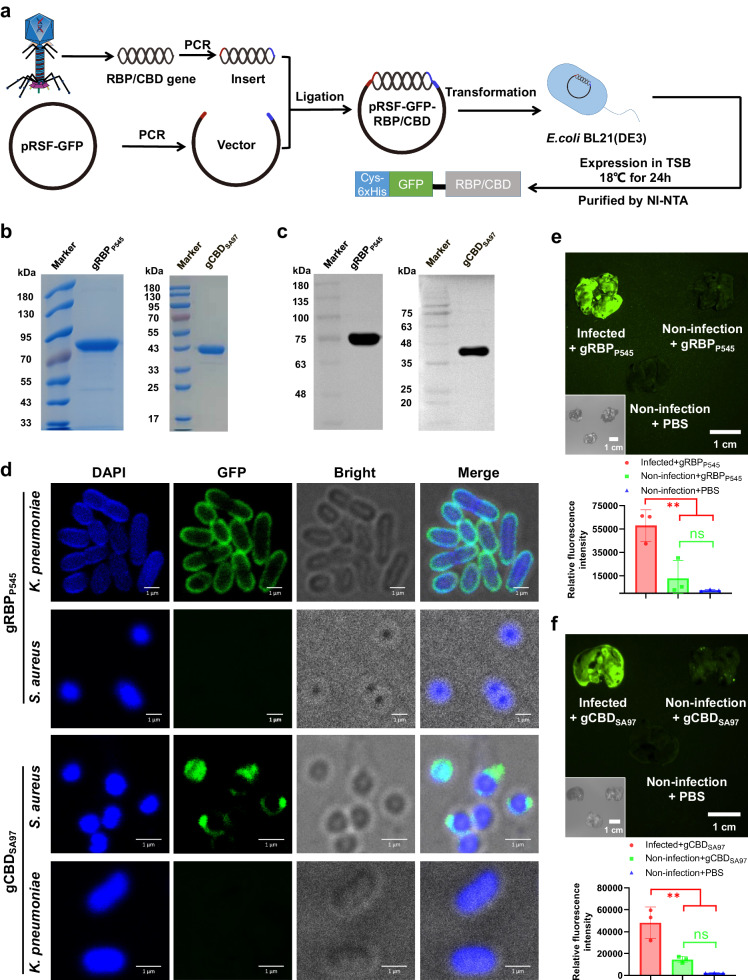
Fig. 2. Heterologous expressed gRBPP545 and gCBDSA97 show selective binding to cultured pathogenic bacteria in vitro and home to pathogenic bacteria-infected lungs in vivo.
a Schematic representation of the heterologous expression of gRBPP545 and gCBDSA97. SDS-PAGE Images (b) and anti-His6 western blot (c) of the heterologously expressed gRBPP545 and gCBDSA97. Three times the experiment was repeated with similar results. d Confocal laser scanning microscopy images of CRKP and MRSA after incubation with gRBPP545 and gCBDSA97 (green). Pathogenic bacteria are visualized under a phase contrast model, and bacterial nucleoid is stained with DAPI (blue). Three times the experiment was repeated with similar results. e Time-gated fluorescence images of gRBPP545 in lungs harvested from mice after 30 min of circulation. K. pneumoniae-induced lung infection was generated by intratracheal inoculation of CRKP. At 24 h post-infection, gRBPP545 was intravenously injected and allowed to circulate for 30 min. After that, lungs were harvested for time-gated fluorescence imaging using a FUSION FX7 EDGE Imaging System. Mice without CRKP infection were treated with the same dose of gRBPP545 or the same volume of PBS as controls. Data are presented as mean ± standard deviation (n = 3 biological replicates). The statistical significance of the data was assessed using one-way ANOVA followed by Tukey’s multiple comparisons test. ns, no significance; **p < 0.001. f Time-gated fluorescence image of gCBDSA97 in lungs harvested from mice after 30 min of circulation. S. aureus-induced lung infection was generated by intratracheal inoculation of MRSA. At 24 h post-infection, gCBDSA97 was intravenously injected and allowed to circulate for 30 min. After that, lungs were harvested for time-gated fluorescence imaging using a FUSION FX7 EDGE Imaging System. Mice without MRSA infection were treated with the same dose of gCBDSA97 or the same volume of PBS as controls. Data are presented as mean ± standard deviation (n = 3 biological replicates). The statistical significance of the data was assessed using one-way ANOVA followed by Tukey’s multiple comparisons test. ns, no significance; **p < 0.001. Source data are provided as a Source Data file.

