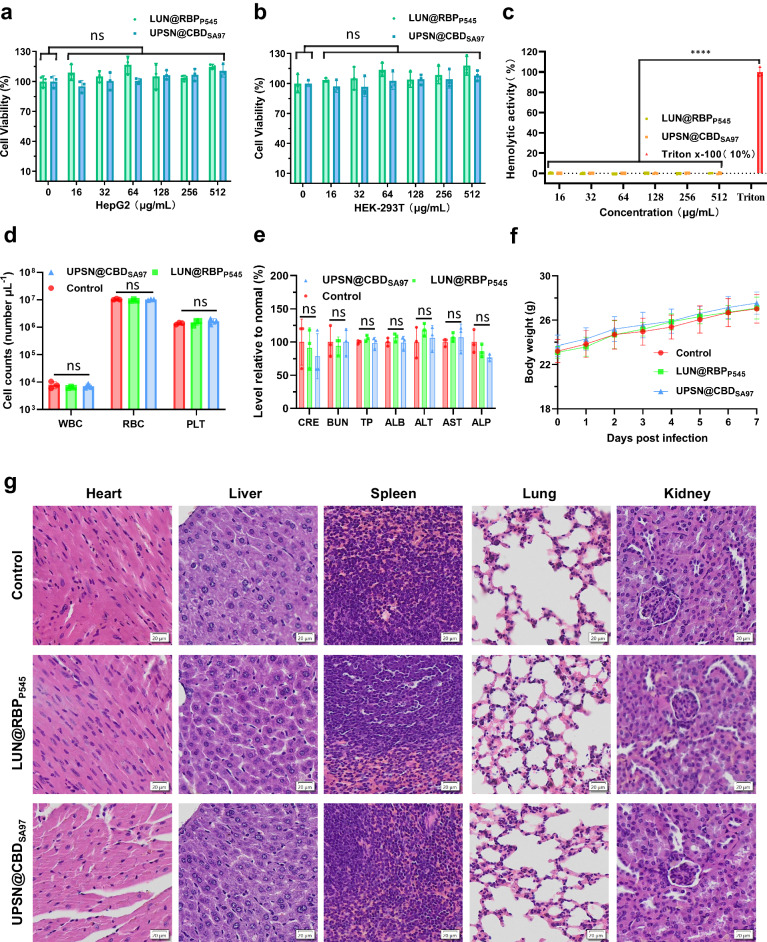
Fig. 5. Biosafety evaluation of LUN@RBPP545 and UPSN@CBDSA97.
Viability of Hep G2 (a) and HEK-293T (b) after treatment with LUN@RBPP545 or UPSN@CBDSA97 at concentrations ranging from 16 to 512 μg/mL for 24 h. Data are presented as mean ± standard deviation (n = 3 biological replicates). The statistical significance of the data was assessed using one-way ANOVA followed by Tukey’s multiple comparisons test. ns, no significance, vs. untreated cells. c Rabbit erythrocytes were incubated with LUN@RBPP545 or UPSN@CBDSA97 at concentrations ranging from 16 to 512 μg/mL. Their hemolytic activity was assessed by the release of hemoglobin. Cells treated without a tested sample were used as no-lysis control. Cells treated with 10% Triton X-100 were used as complete lysis control. Data are presented as mean ± standard deviation (n = 3 biological replicates). The statistical significance of the data was assessed using one-way ANOVA followed by Tukey’s multiple comparisons test. ****p < 0.001 vs. 10% Triton X-100-treated cells. d Counts of various blood cells 7 days after that of LUN@RBPP545 and UPSN@CBDSA97 administration. WBC, white blood cells; RBC, red blood cells; PLT, platelets. Data are presented as mean ± standard deviation (n = 3 biological replicates). The statistical significance of the data was assessed using one-way ANOVA followed by Tukey’s multiple comparisons test. ns, no significance. e Comprehensive blood chemistry panel taken 7 days after that of LUN@RBPP545 and UPSN@CBDSA97 administration. CRE, creatinine; BUN Blood urea nitrogen; TP Total protein, ALB albumin; ALT alanine transaminase, AST Aspartate transaminase, ALP Alkaline phosphatase. Data are presented as mean ± standard deviation (n = 3 biological replicates). The statistical significance of the data was assessed using one-way ANOVA followed by Tukey’s multiple comparisons test. ns, no significance. f Body weight changes were recorded after treatment with LUN@RBPP545, UPSN@CBDSA97, or PBS over 7 d. Data are presented as mean ± standard deviation (n = 10 biological replicates). g Haematoxylin and eosin staining of histology sections from major organs 7 days after the intravenous administration of LUN@RBPP545 and UPSN@CBDSA97. Scale bars, 20 μm. Independent experiments (n = 3 biological replicates) were performed with similar results. Source data are provided as a Source Data file.

