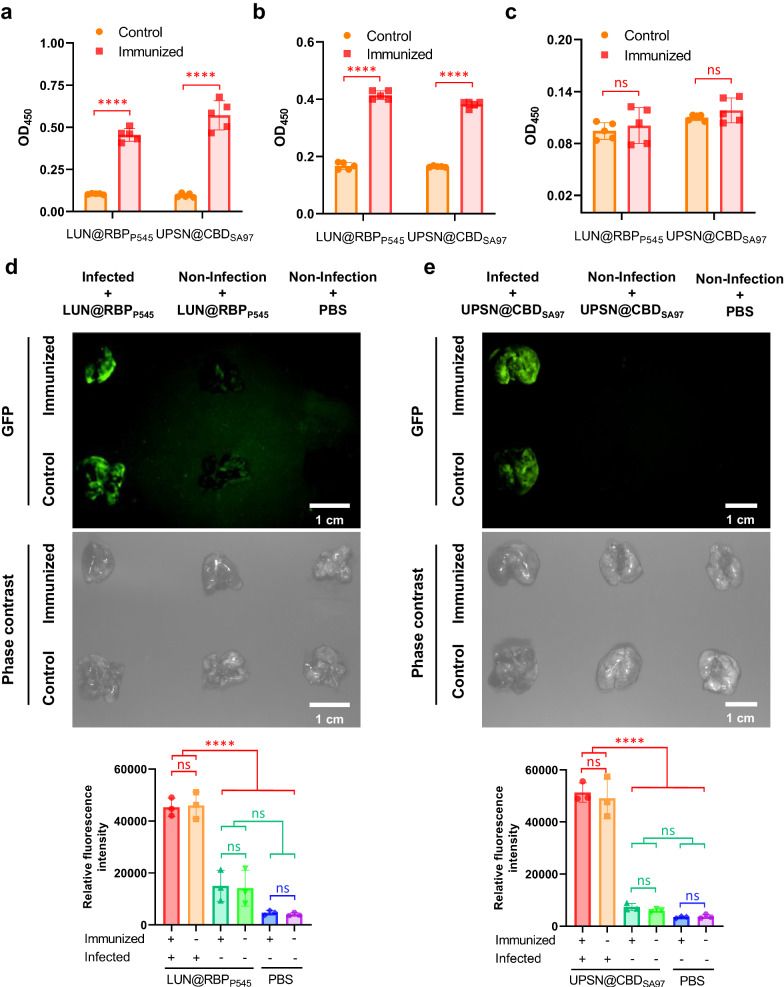
Fig. 6. LUN@RBPP545 and UPSN@CBDSA97 are re-applicable.
Levels of RBPP545-specific and CBDSA97-specific antibodies, IgG (a), IgM (b), and IgA (c), after immunization of LUN@RBPP545 and UPSN@CBDSA97, respectively, for twice. Antibody titers for RBPP545 and CBDSA97 in mouse serum were determined by ELISA using 1000-fold diluted samples (IgG) or 100-fold diluted samples (IgM and IgA). Data are presented as mean ± standard deviation (n = 5 biological replicates). The statistical significance of the data was assessed using one-way ANOVA followed by Tukey’s multiple comparisons test. ns, no significance; ****p < 0.0001. d Time-gated fluorescence image of LUN@RBPP545, in which RBPP545 was fused with GFP (green), in lungs harvested from mice after 30 min of circulation. LUN@RBPP545 immunized and PBS-treated mice were intravenously inoculated with K. pneumoniae to generate the CRKP-induced lung infection mouse model. At 24 h post-infection, LUN@RBPP545 was intravenously injected and allowed to circulate for 30 min. After that, lungs were harvested for time-gated fluorescence imaging using a FUSION FX7 EDGE Imaging System. Mice without CRKP infection were treated with the same dose of LUN@RBPP545 or the same volume of PBS as controls. Data are presented as mean ± standard deviation (n = 3 biological replicates). The statistical significance of the data was assessed using one-way ANOVA followed by Tukey’s multiple comparisons test. ns, no significance; ****p < 0.0001. e Time-gated fluorescence image of UPSN@CBDSA97, in which CBDSA97 was fused with GFP (green), in lungs harvested from mice after 30 min of circulation. UPSN@CBDSA97 immunized and PBS-treated mice were intravenously inoculated with S. aureus to generate the MRSA-induced lung infection mouse model. At 24 h post-infection, UPSN@CBDSA97 was intravenously injected and allowed to circulate for 30 min. After that, lungs were harvested for time-gated fluorescence imaging using a FUSION FX7 EDGE Imaging System. Mice without MRSA infection were treated with the same dose of UPSN@CBDSA97 or the same volume of PBS as controls. Data are presented as mean ± standard deviation (n = 3 biological replicates). The statistical significance of the data was assessed using one-way ANOVA followed by Tukey’s multiple comparisons test. ns, no significance; ****p < 0.0001. Source data are provided as a Source Data file.

