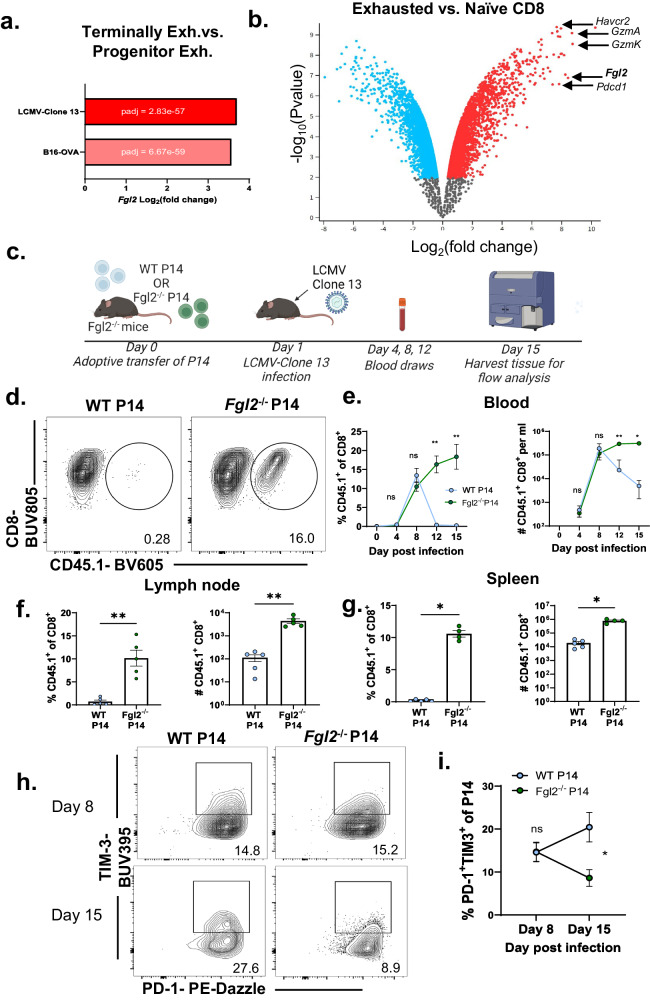
Fig. 3. Fgl2 is increased in exhausted P14 CD8+ T cells during LCMV Clone 13 infection, conditional deletion from virus-specific CD8+ T cells increases persistence and decreases exhaustion.
a Bar graph showing Fgl2 expression (log2 fold change) in antigen-specific CD8+ T cells isolated from LCMV-Clone 13 (n = 9,194 cells, adjusted p value = 2.83 × 10−57) and B16-OVA (n = 4313 cells, adjusted p value = 6.67 × 10−59) in the publicly available single-cell RNA-sequencing dataset deposited by Miller et al. comparing progenitor exhausted vs. terminally exhausted CD8+ T cells. b Volcano plot showing expression of genes upregulated in exhausted antigen-specific CD8+ vs. naive CD8+ T cells isolated on day 45 post LCMV-Clone 13 infection from the dataset deposited by Im et al., analyzed with GEO2R. c Schematic wherein Fgl2−/− mice are given WT or Fgl2−/− P14 one day prior to LCMV clone 13 infection. Mice were bled on days 4, 8, 12 and 15 and then sacrificed on day 15. d Representative flow plots and e time course of frequency (p = 0.0095 and p = 0.0079 for day 12 and day 15 comparisons respectively) and cell number (p = 0.0043 and p = 0.0159 for day 12 and day 15 comparisons respectively) per ml of CD45.1+ congenic marked WT (blue symbols) or Fgl2−/− P14 (green symbols) within CD8+ T cell subset in the blood (n = 6 mice per group). Frequency and cell number of P14 in the f lymph nodes (n = 5 mice per group). (p = 0.0079 and p = 0.0079 respectively) and g spleen in Clone 13-infected mice is also shown (n = 5 mice in WT P14 group and 4 mice in the Fgl2−/− P14 group) (p = 0.0159 and p = 0.0159 respectively). h Representative flow plots and i summary data showing frequency of PD-1+TIM-3+ P14 in WT (blue symbols) vs. Fgl2−/− P14 (green symbols) on day 8 vs. day 15 post infection (n = 13 mice in the WT P14 group and 10 mice in the Fgl2−/− P14 group), p = 0.0173 for day 15 comparison). Representative data from two independent experiments. Mann-Whitney non-parametric, unpaired two-sided tests were used. The error bar, in summary, figures denotes mean ± SEM. **p < 0.01. Source data are provided as a Source Data file. c is created with BioRender.com released under a Creative Commons Attribution-NonCommercial-NoDerivs 4.0 International license.

