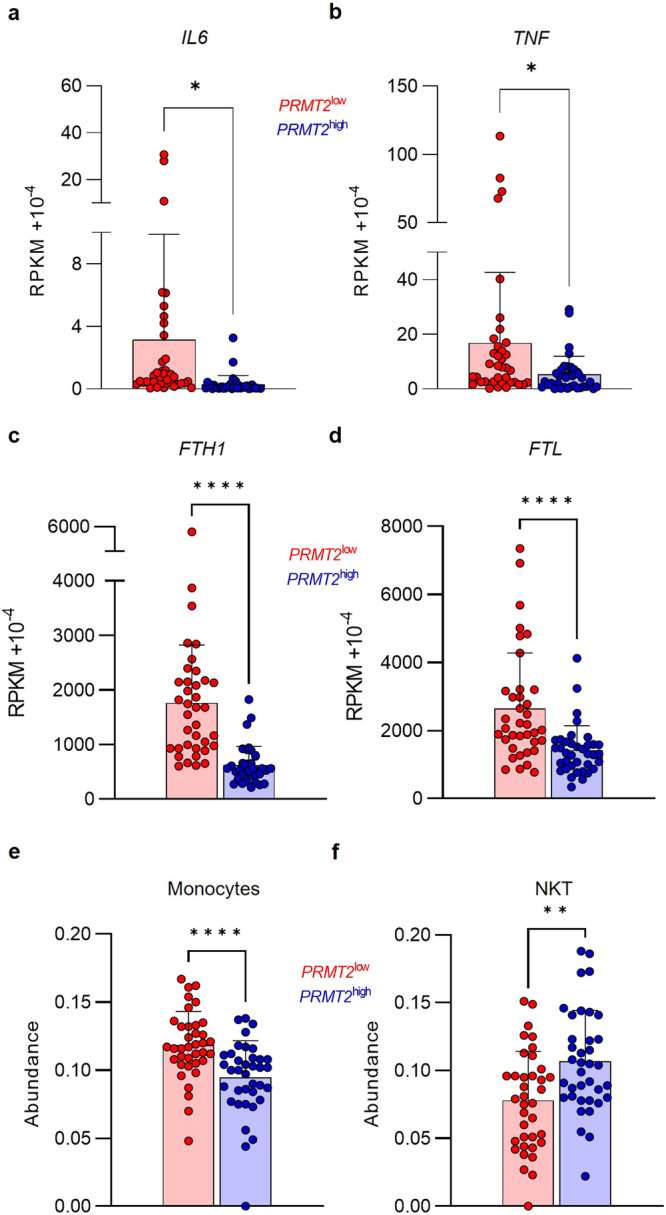
Fig. 2. PRMT2 is associated with inflammatory factors’ expression.

Gene expression of IL6 (a), TNF (b), FTH1 (c) and FTL (d) within the PRMT2low patients in red (n = 37) and PRMT2high patients in blue (n = 37). ImmuCellAI analysis showing monocyte (e) and NKT cell (f) abundance within the PRMT2low patients in red (n = 37) and PRMT2high patients in blue (n = 37). Error bars represent the mean ± SD. Paired t tests with p values indicated in the graphs: *p < 0.05; **p < 0.01; ****p < 0.0001.
