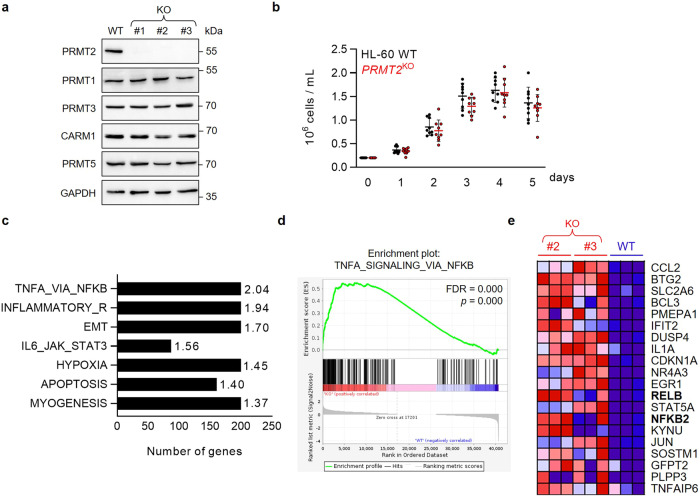
Fig. 3. The loss of PRMT2 increases the inflammatory phenotype of leukemic cells in vitro.
a Western Blot analysis on WT HL-60 or three different clones of PRMT2KO (KO) cells for PRMT2 and other PRMT (-1, -3, CARM1, and PRMT5) protein expressions. GAPDH is used as loading control. The presented blot is a representative figure from three independent experiments. b Assessment of cell proliferation of the 3 PRMT2KO clones compared to WT HL-60 cells by cell counting, shown as mean ± SD of three independent experiments (n = 9). c The bar graph represents the most significantly overrepresented hallmarks after a gene set enrichment analysis (GSEA) of #2 and #3 PRMT2KO clones compared to WT with normalized enrichment scores on the right. All gene sets are FDR < 25% and p < 0.01. d GSEA plot for the “TNFA signaling via NFKB” hallmark with FDR and nominal p indicated. e Heatmap representing the top 20 enriched genes of the “TNFA signaling via NFKB” hallmark. NF-κB-related genes appear in bold.

