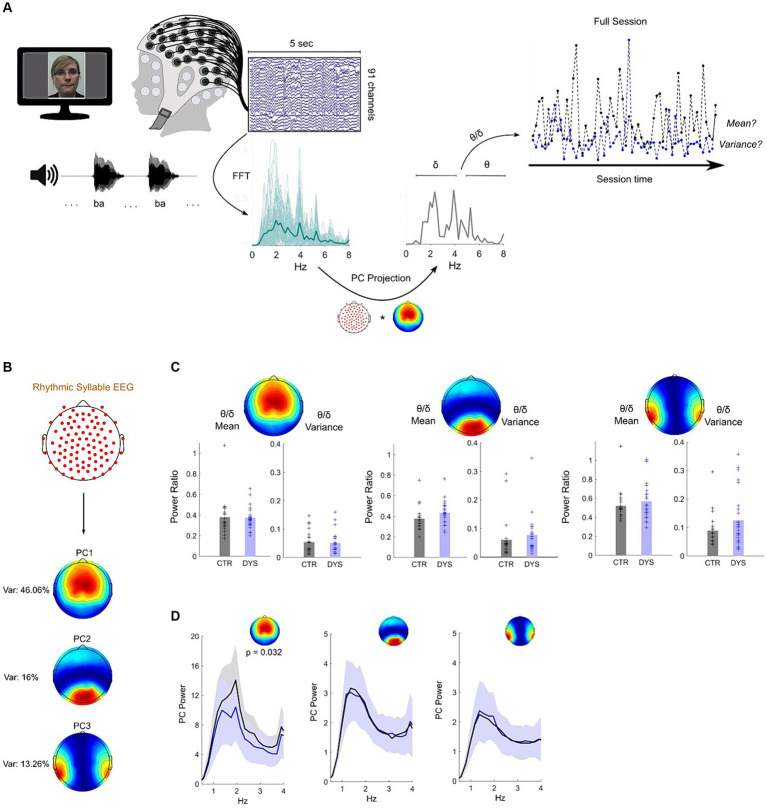
Figure 2.
Dyslexia-specific theta/delta power ratio differences for speech processing do not transfer to rhythmic syllable repetition. (A) Paradigm and pseudo-online analysis pipeline (see Methods). EEG projection to PC1 was used for illustration. Sessions from a dyslexic (blue) and a typically-developing child (black) are shown. (B) Map of the three most important principal components – closely matching those of the story listening task (see Figure 1B). (C) No group differences were observed across all three PCs for theta/delta ratio mean or variance (CTR – typically-developing children, DYS – dyslexic children). (D) Typically-developing children show higher delta band power on PC1 only, which was maximal at the syllable presentation rate (2 Hz).

