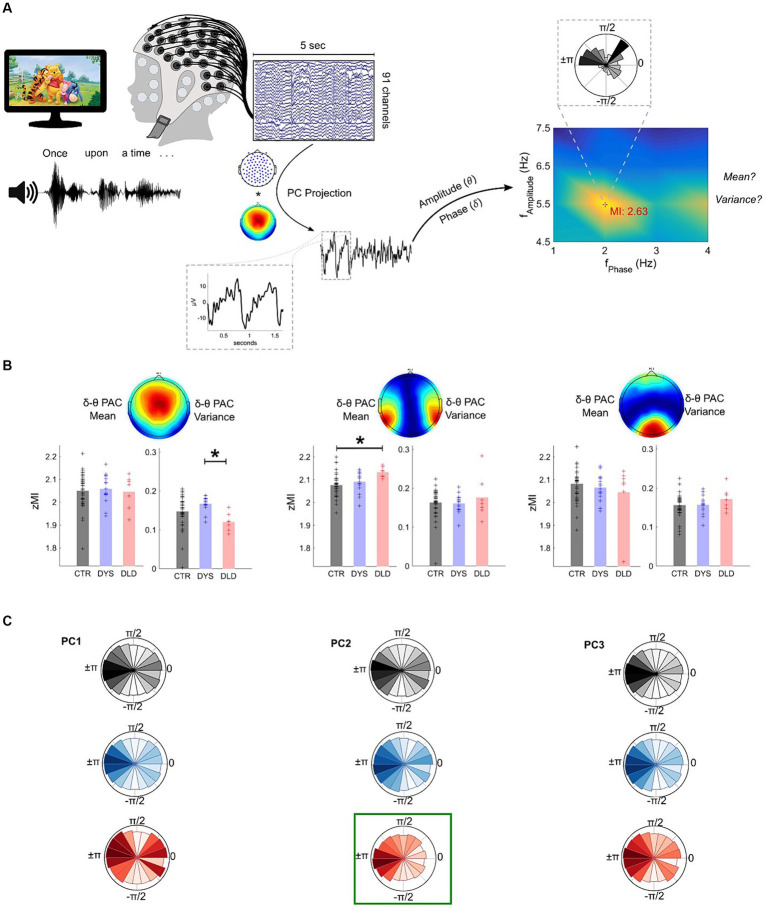
Figure 3.
DLD children exhibit atypical delta-theta Phase-Amplitude Coupling (PAC) during speech listening (story listening task). (A) Analysis pipeline example using a single epoch. The comodulogram with the z-scored Modulation Index (zMI) values and phase-amplitude polar plots of maximum cross-frequency coupling are shown. (B) Phase-Amplitude Coupling (PAC) results. DLD children show significantly lower variance than dyslexic children for PC1 and significantly higher mean than typically-developing children for PC2. * p < 0.05 (Bonferroni corrected). (C) Polar plots showing the concentration of theta amplitudes across delta phase bins. A relatively higher concentration of high theta amplitudes on PC2 at ±π can be observed for DLD children (highlighted in green) when compared to the other groups.

