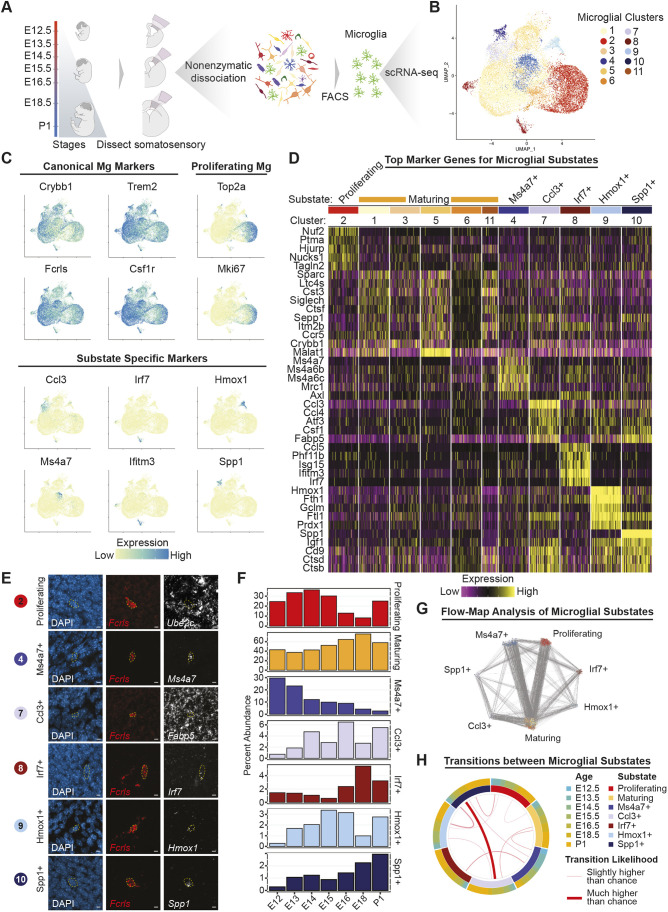
Fig. 2.
Comprehensive atlas of embryonic microglia. (A) Overview of experimental design for isolation of microglia for scRNA-seq. (B) UMAP visualization of microglia scRNAseq data from the developing somatosensory cortex of wild-type mice (combined UMAP representing 11 samples of 5-10 pooled embryos each, n=21,135 total microglia). Cells are colored by microglia cluster assignment. (C) UMAP plots from B colored for expression of canonical, proliferating and substate-specific microglial marker genes. (D) Heat map of the most differentially expressed genes in each microglia substate, grouped by cluster. (E) Multiplex RNA in situ hybridization (RNAScope) at E15.5 of key markers for individual microglial substates and the pan-microglial marker Fcrls (Fcrl2). Images are from the following dorsal cortical regions: ventricular zone (Ube2c and Irf7), subventricular zone (Spp1), and intermediate zone (Ms4a7, Fabp5 and Hmox1). Scale bars: 5 μm. (F) Bar charts of microglial substate proportions over developmental time. (G) A force-directed weighted graph created by FLOWMAP algorithm representing microglia substate transitions. Cells are grouped by substates and each gray line represents one likely transition between cell types due to transcriptional similarity. The largest number of transitions occur between Ms4a7+ and maturing microglia, and between proliferating and maturing microglia. (H) Over-represented microglial substate transitions across time created using the BioCircos R package. The inner circle represents each substate, while the outer circle shows the distribution of ages of cells within each substate. Lines connecting substates depict transitions that happen more likely than chance when taking into account the number of cells within each substate, as calculated by a Fisher's exact test (FDR adjusted P<0.01). Line thickness represents the odds ratio of a transition, as calculated using Fisher's exact test.

