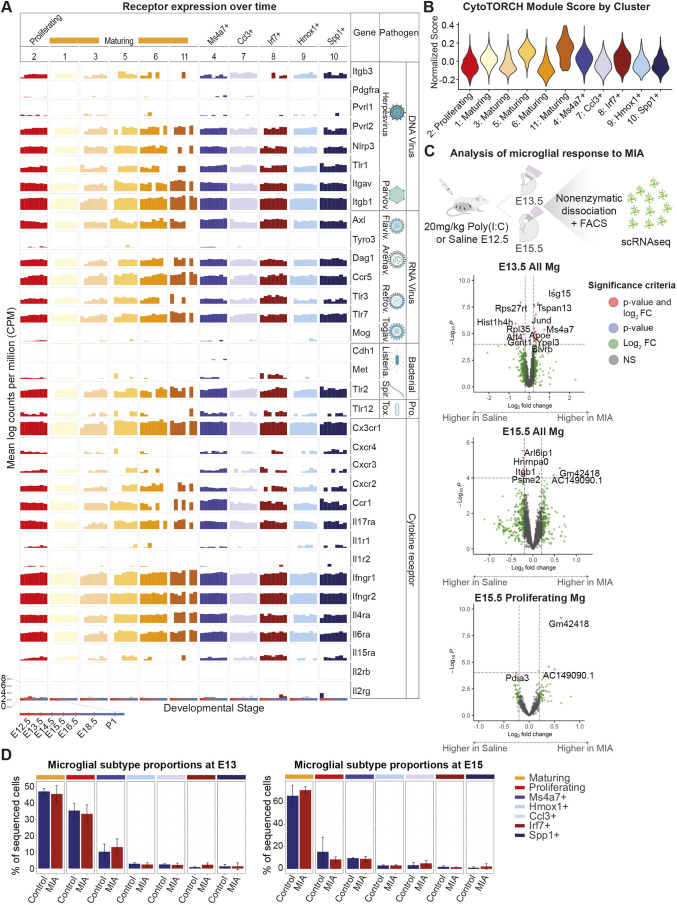
Fig. 3.
Microglial substates transcriptional changes after MIA. (A) Bar plot of TORCH pathogen and cytokine receptor expression (mean log counts per million) in each microglia cluster across development using a developmental microglial atlas. (B) Violin plot of CytoTORCH module score for each microglia cluster. (C) Overview of experimental design (top) and volcano plots (bottom) showing differentially expressed genes in microglia from the embryonic prospective somatosensory cortex after maternal Poly(I:C) or saline injection. A total of 30,985 cells were sequenced, comprising six pooled samples from a total of 37 embryos for saline-treated controls, and six pooled samples from a total of 32 embryos for MIA. Genes are color coded according to enrichment (log2FC>0.15 and −log10Benjamini-Hochberg adj. P<0.05). Dotted lines represent enrichment cut-offs. Top signature genes are annotated. Log fold-change and P-values were generated with a generalized linear model with Benjamini-Hochberg correction using DESeq2. (D) Bar plot showing embryonic microglial substate proportions after maternal injection of saline when compared with Poly(I:C). A generalized mixed effects binomial models showed no significant changes in substate proportions between treatment groups. Error bars represent one standard deviation in substate proportion. Created with BioRender.com.

