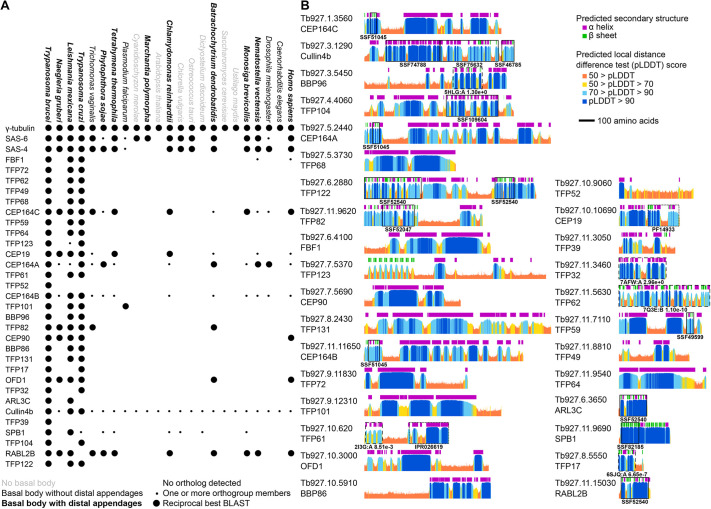
Fig. 2.
Evolutionary conservation profile and protein structure prediction of T. brucei TFPs. (A) Presence or absence of orthologues of T. brucei TFPs across diverse eukaryotes, in comparison to control tubulin nucleation (γ-tubulin) and basal body (SAS-6, SAS-4) proteins. Large circles indicate presence of an orthologue detectable by reciprocal best BLAST, small circles indicate one or more orthogroup members but not a reciprocal best BLAST. Species fonts indicate their ability to form basal bodies and distal appendages, as previously described (Carvalho-Santos et al., 2011). Cullin4b, CUL4B. (B) AlphaFold2 structure predictions of all T. brucei TFPs. As a large majority of predictions showed extended α-helices or no predicted structure, showing the structures is often not highly informative. Instead, we summarise the structures as per-residue plots of predicted local distance difference test (pLDDT) and predicted secondary structure, using the dictionary of secondary structure program (DSSP) on the predicted structure. Protein domains predicted by sequence similarity are marked with boxes: solid boxes for superfamily domains (accessions starting SS), dotted boxes for other database predictions (reserved for when no superfamily domain hit was in that protein region; accessions starting IPR, InterPro; accessions starting PF, Pfam). Dashed boxes show globular regions where we carried out structural similarity comparisons to experimentally determined structures using FoldSeek (PDB IDs are shown alongside E-values).

