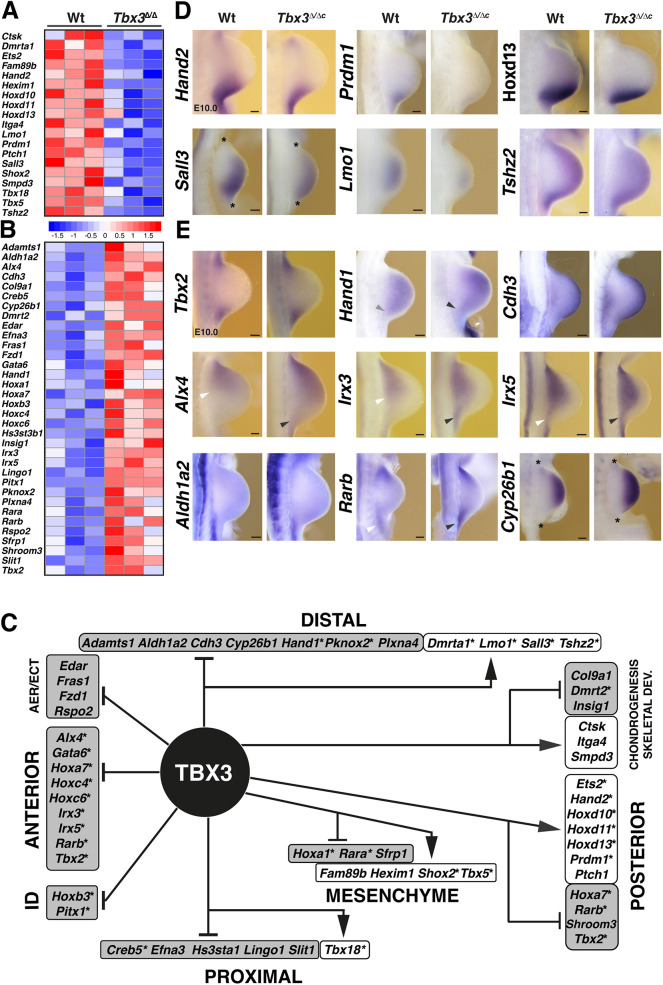
Fig. 3.
TBX3 candidate target gene regulatory network in early limb development. (A,B) Heatmaps illustrating relative gene expression of developmental regulators in wild-type (Wt) and Tbx3-deficient samples (n=3 biological replicates, E9.75-E10.0). The z-score scale represents mean-subtracted regularised log-transformed read counts. Shown are genes (n=53) that have essential functions in limb buds (Table S5). (C) TBX3 target GRN for early limb buds. In addition, target genes expressed in the AER and ectoderm (ECT), functioning in limb identity (ID) or chondrogenesis and skeletal development are shown. Arrows point to genes for which expression is positively regulated by TBX3 (white boxes), and inhibitory lines indicate genes for which expression is repressed (grey boxes). Asterisks indicate TFs. (D,E) WISH analysis of select genes in wild-type and Tbx3Δ/Δc mouse forelimb buds (E9.75-E10.25, 29-32 somites). Asterisks indicate limb bud margins for some limb buds (D). Arrowheads indicate the posterior expression boundaries (Alx4, Irx3, Irx5) or upregulation (Hand1) in wild-type (white) and mutant (grey) limb buds. Forelimb buds are oriented with anterior to the top and posterior to the bottom. Scale bars: 100 µm.

