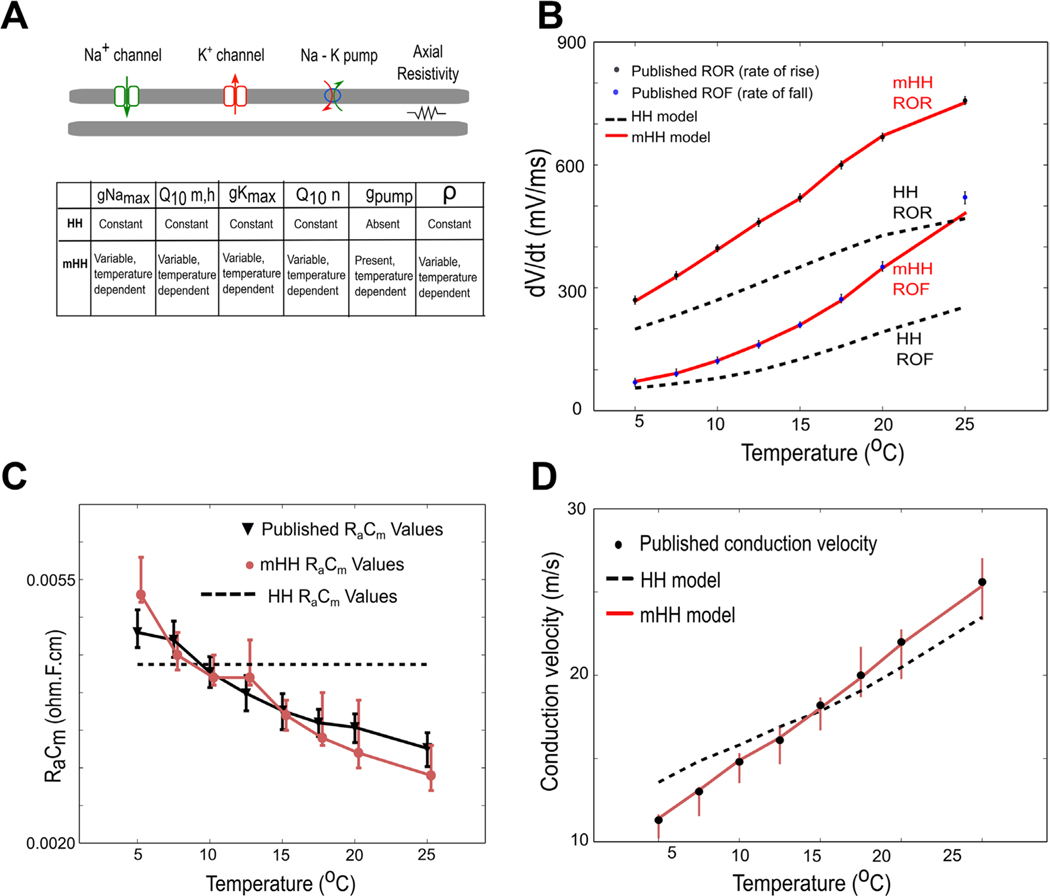
Figure 1.
Incorporating temperature dependence into multiple features of the Hodgkin/Huxley model leads to an improved match to experimental data. (A) Schematic indicating how the modified model incorporates more temperature-dependent features than the original Hodgkin/Huxley model. The symbol represents axial resistivity. (B) Comparisons of model outputs to experimental data measuring rates of rise or fall of squid action potentials (dots and error bars correspond to data from Rosenthal and Bezanilla (2000)). Light red line labeled mHH ROR shows the modified Hodgkin/Huxley model fit to data for rate of rise, whereas the black dashed line labeled HH ROR shows the predictions of the unmodified Hodgkin/Huxley model for the rate of rise. Light red line labeled mHH ROF shows the modified Hodgkin/Huxley model fit to data for rate of fall, whereas the black dashed line labeled HH ROF shows the predictions of the unmodified Hodgkin/Huxley model for rate of fall. (C) Comparison of measured product of membrane capacitance and axial resistance () to values predicted by the two models. Black line, triangles and error bars are values measured by Rosenthal and Bezanilla (2000) in squid giant axons. Light red line, dots and error bars correspond to values predicted by the modified Hodgkin/Huxley model. The dashed line, which is temperature-independent, corresponds to the value used in the original Hodgkin/Huxley model. (D) Comparisons of measured conduction velocity to model predictions. Note that the light red line corresponding to the mHH model yields a better match to the experimental data (dots and error bars) than the black dashed line corresponding to the original Hodgkin/Huxley model.

