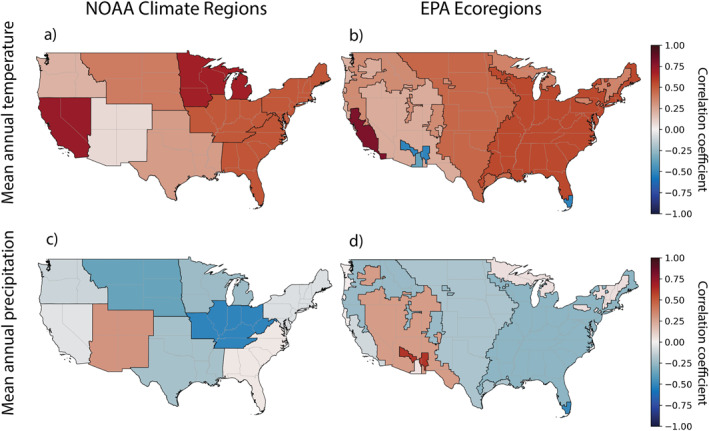
Figure 4.

Spearman rank correlations between mean annual temperature (a, b) and precipitation (c, d) (°C and mm/year, respectively) and WNND case incidence (cases per 100,000 population), partitioned into NOAA climate regions (a, c) and EPA ecoregions (b, d). We omit maximum and minimum temperature maps to reduce redundancy.
