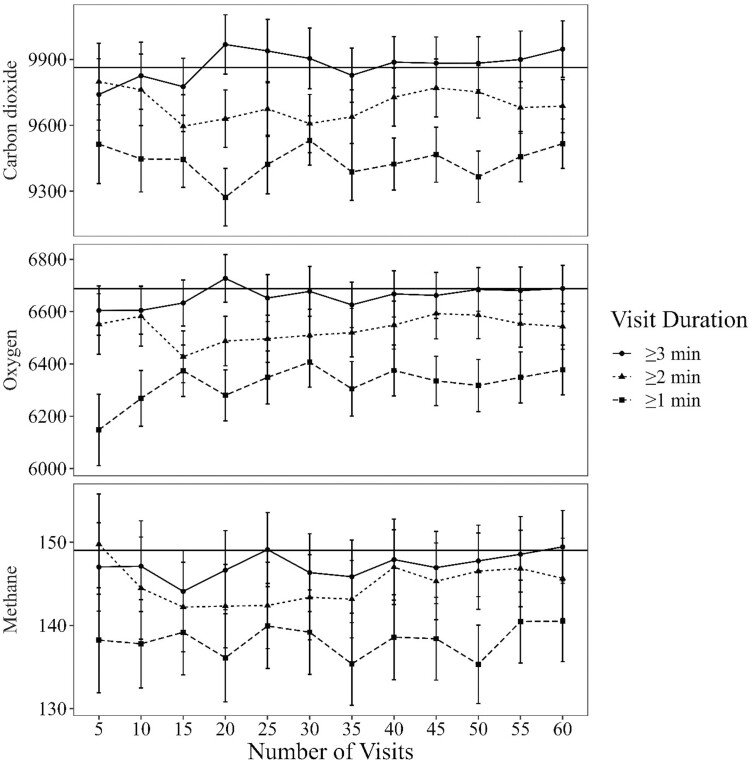
Figure 2.
Average carbon dioxide emission, oxygen consumption, and methane emissions estimates (all in g/d) derived from an automated head chamber system (AHCS; GreenFeed, C-Lock Inc., Rapid City, SD). Estimates are three visit duration thresholds (≥ 3 min., ≥ 2 min., or ≥ 1 min.) and with number of visits (5 to 60, increasing by increments of 5) selected at random. The error bars represent the standard error of the mean. The horizontal line represents the average of the “gold-standard” [average of all visits ≥ 3 min. visit duration (144 ± 55.01 min; mean ± standard deviation; n = 53 animals)]. Data used in this analysis is from Proctor (2023).

