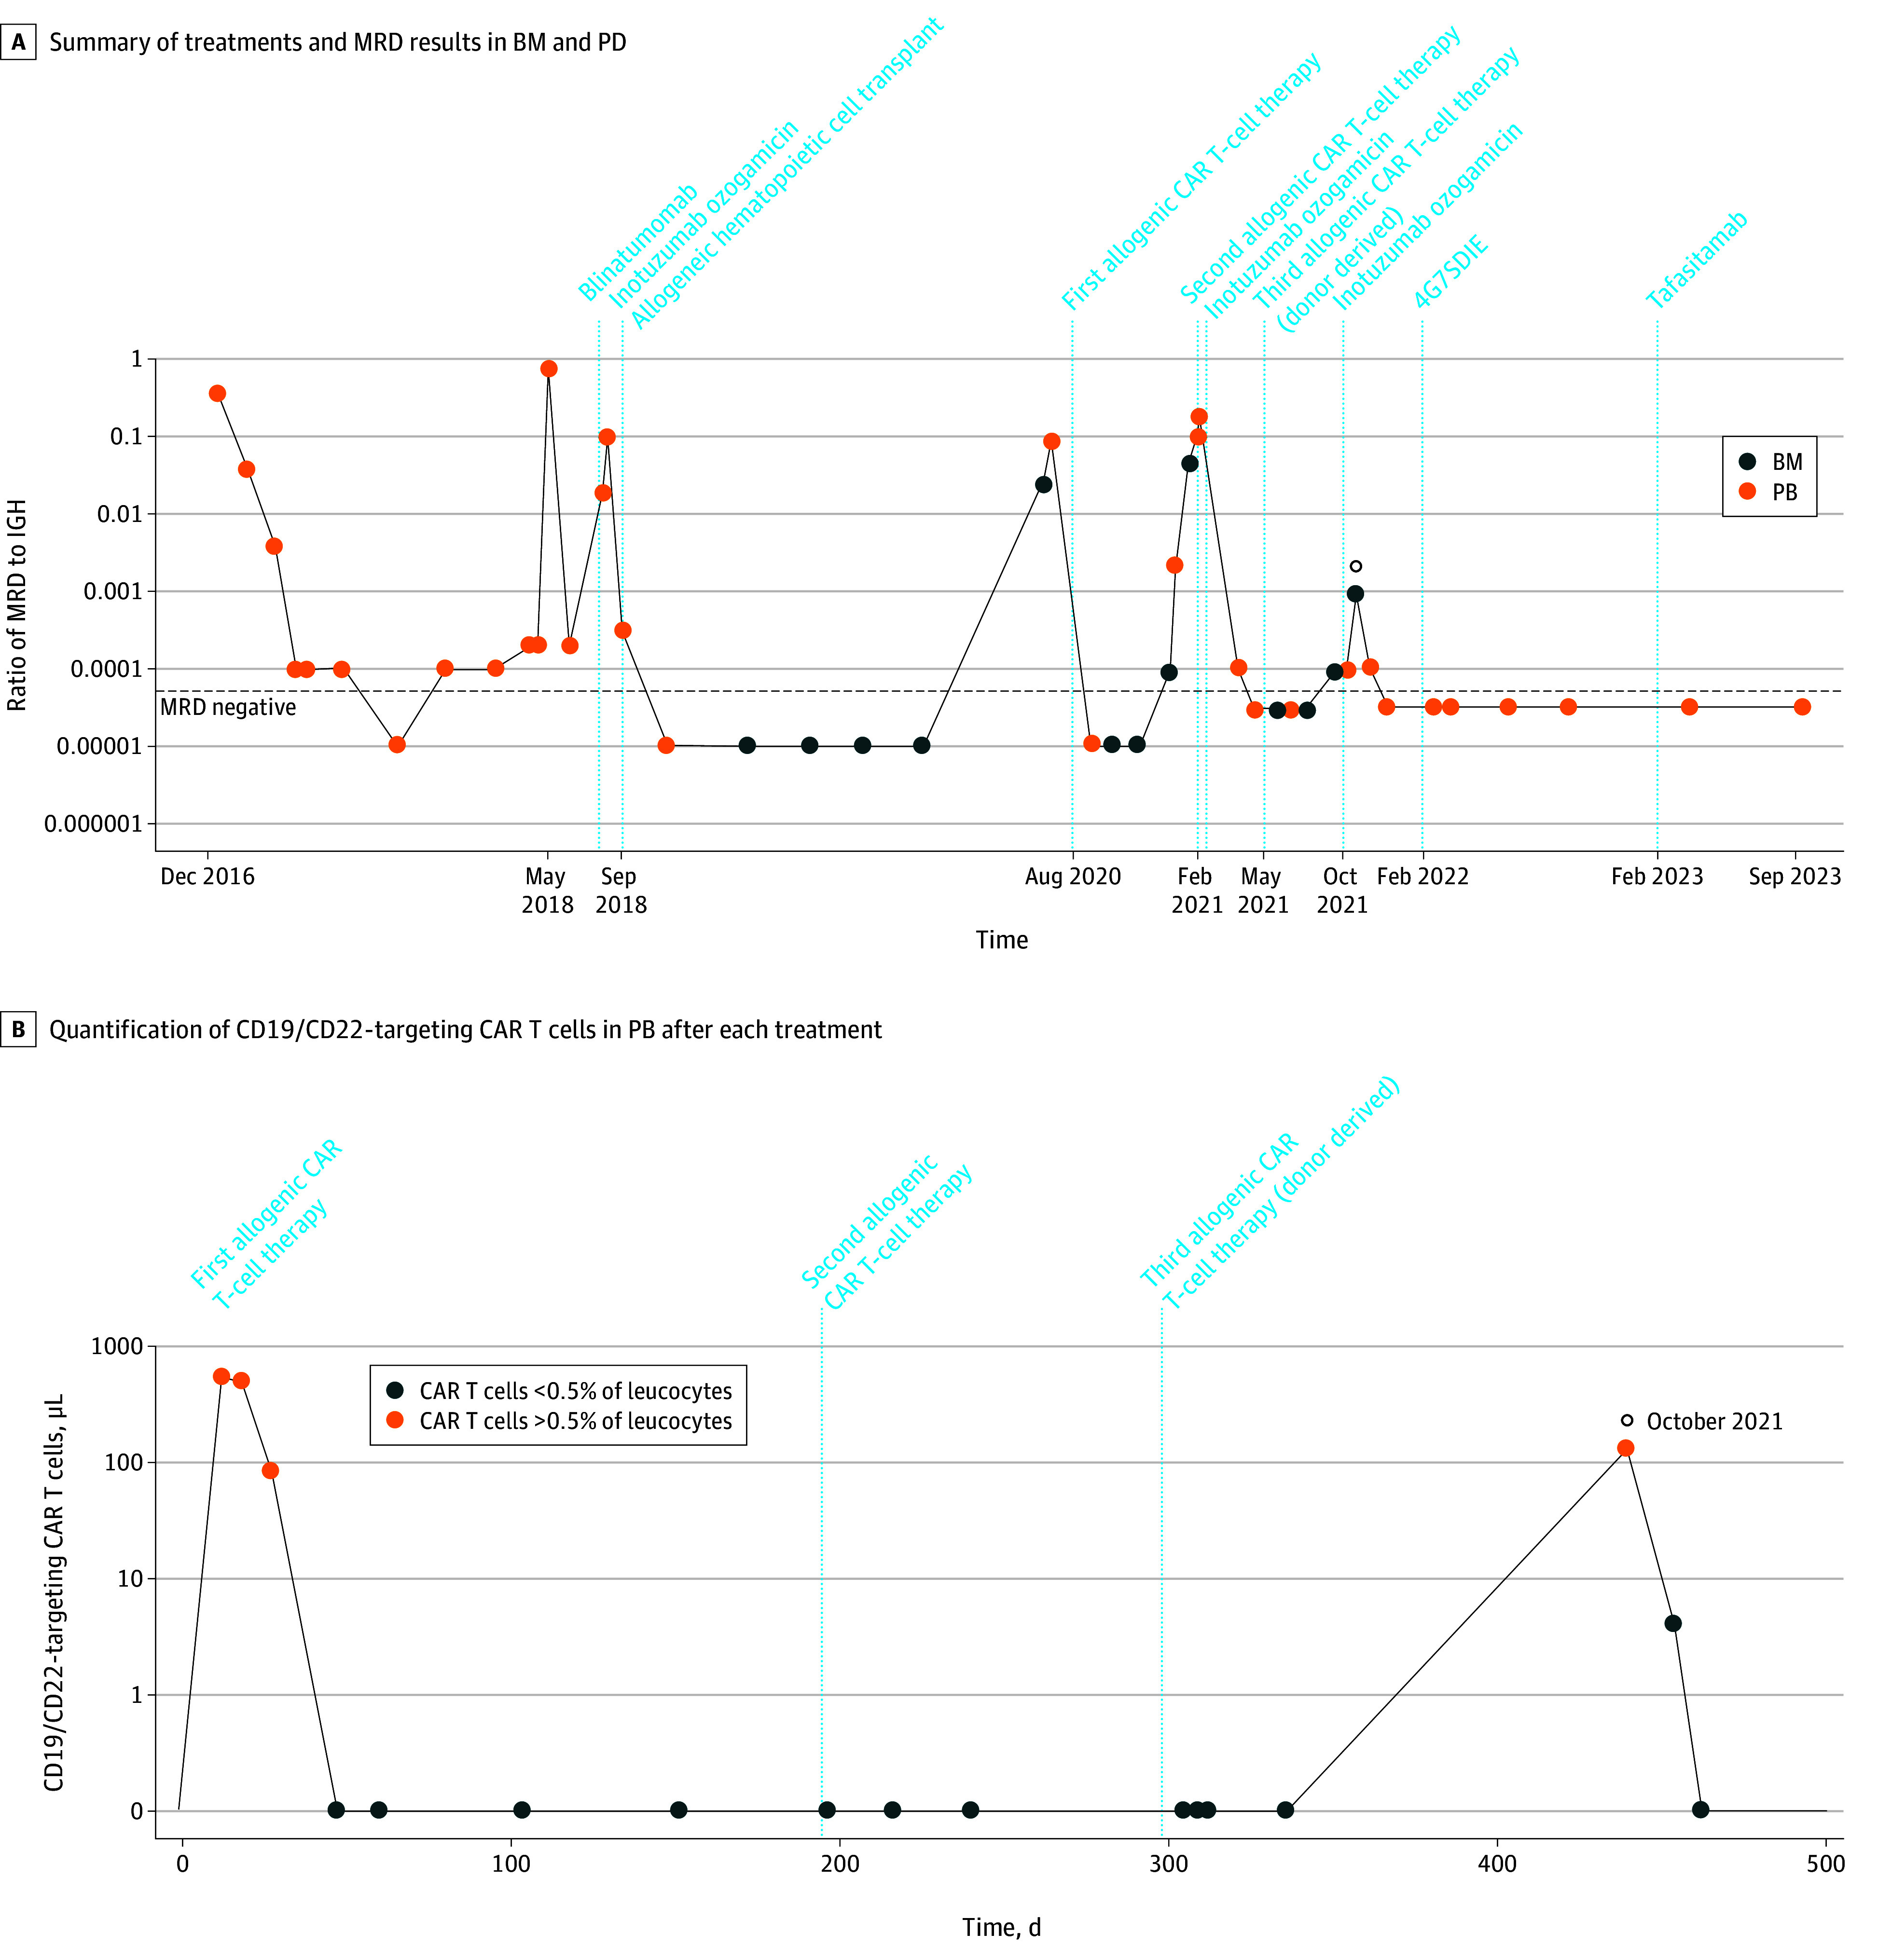
Figure 1. Treatment Response and Chimeric Antigen Receptor (CAR) T-Cell Quantification in Patient 1.

A, Summary of treatments and minimal residual disease (MRD) results in bone marrow (BM) and peripheral blood (PB) (IGHV3-21 and D3-16 J8 along logarithmic scale; MRD negativity defined as <1 × 10⁴, represented by the horizontal dashed line; the open circle marks a rise in MRD). B, Quantification of CD19/CD22-targeting CAR T cells in PB after each CAR T-cell treatment (the open circle marks CAR T-cell expansion at the rise of MRD).
