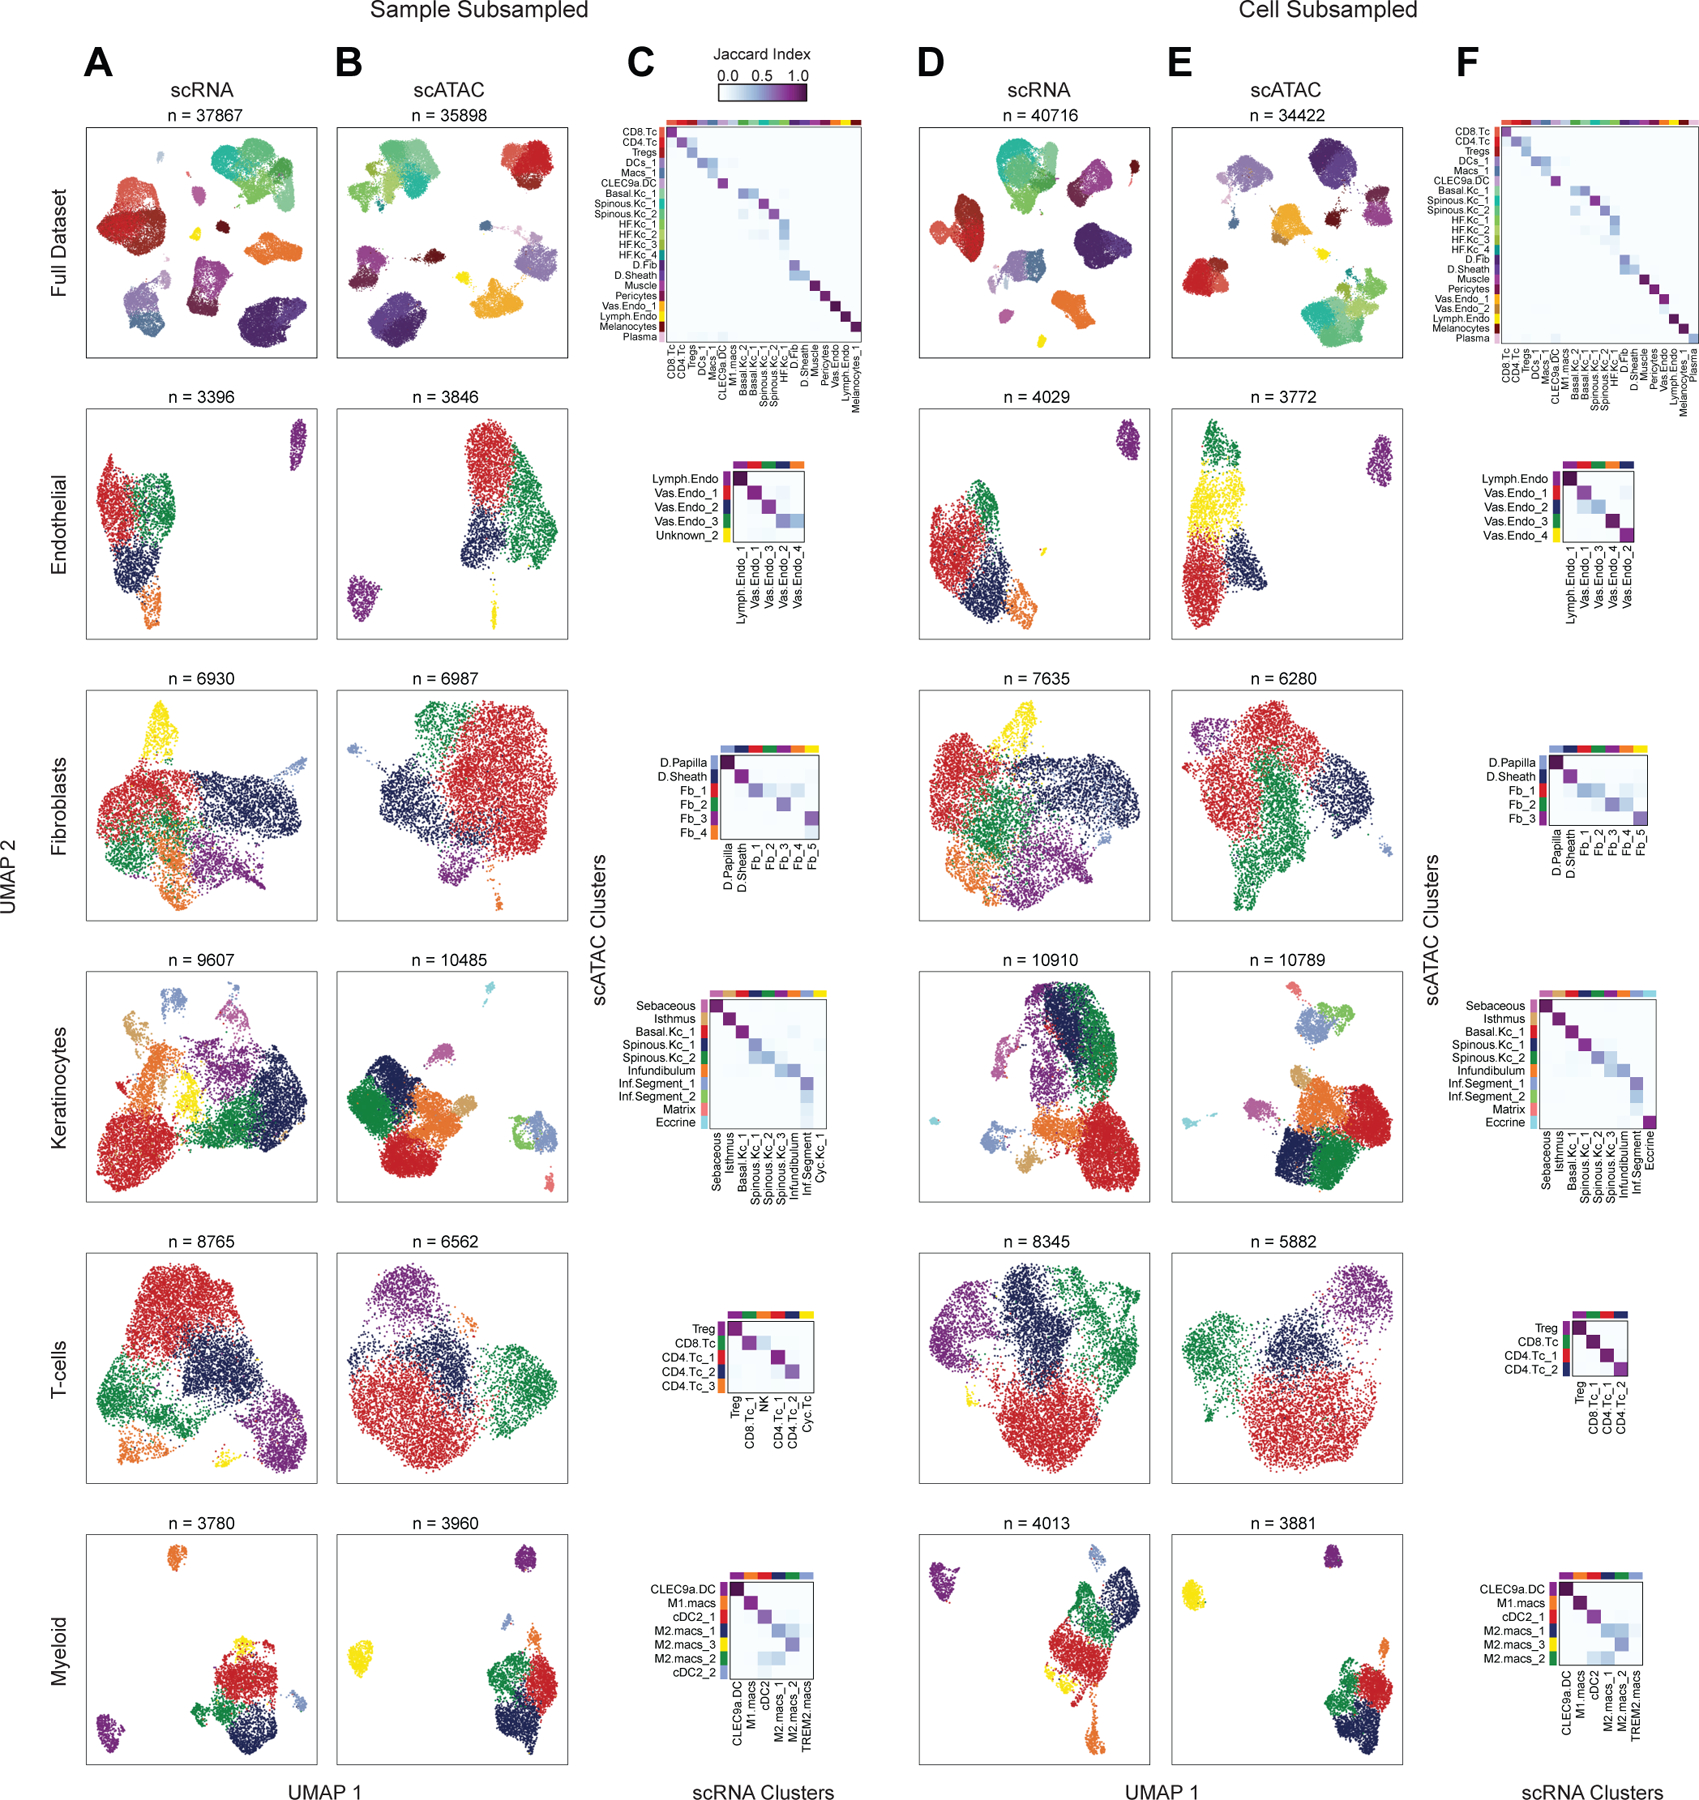
Extended Data Fig. 4 |. Clustering and CCA-based scRNA to scATAC-seq integration robustness to subsampling. Related to Figure 2.

(A through C) Repeated dimensionality reduction and clustering of the scRNA and scATAC-seq datasets with three samples (AA4, C_SD3, and C_PB3) removed from the full dataset.
(A) UMAP representations of the full subsampled dataset and sub-clustered major cell groups using scRNA data. Cell compartments are labeled on the left, and cells are colored according to their high-resolution cluster labels as shown in the x-axis in (C).
(B) UMAP representations of the full dataset and sub-clustered major cell groups using scATAC data. Cell compartments are labeled on the left, and cells are colored according to their high-resolution cluster labels as shown in the y-axis in (C).
(C) Correspondence between scRNA and scATAC-seq cluster labels for the low- and high-resolution clusters in each of the subsampled datasets.
(D through F) Repeated dimensionality reduction and clustering of the scRNA and scATAC-seq datasets with 25% of the cells randomly removed from the full dataset.
(D) Same as in (A), but for the cell-subsampled dataset.
(E) Same as in (B), but for the cell-subsampled dataset.
(F) Same as in (C), but for the cell-subsampled dataset.
