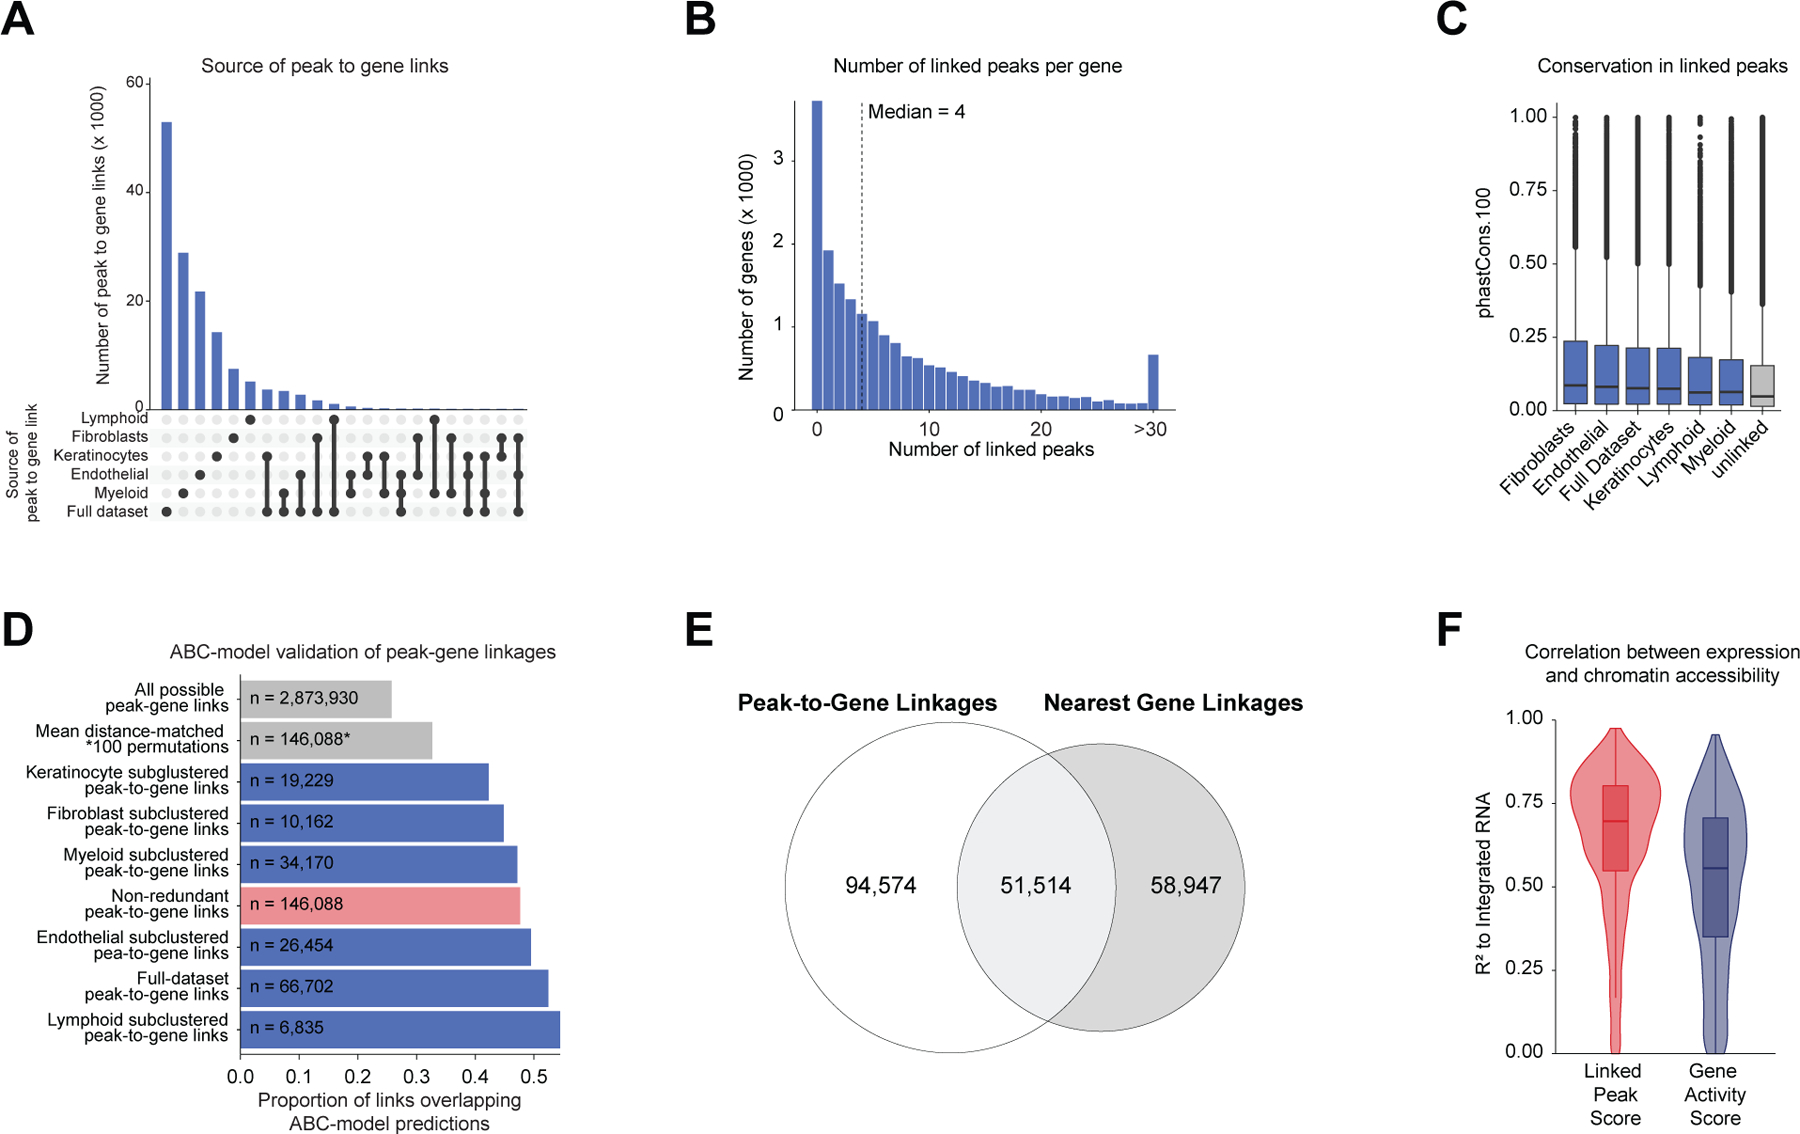
Extended Data Fig. 5 |. Identification and characterization of peak-to-gene linkages. Related to Figure 2.

(A) Upset plot indicating the number of peak-to-gene linkages identified in the full dataset and in each of the sub-clustered datasets.
(B) The distribution of the number of linked peaks per gene (median = 4).
(C) The PhastCons 100-way vertebrate conservation scores for peaks with a linked gene in each dataset compared to unlinked peaks. Wilcoxon rank-sum test comparing each dataset to unlinked peaks, p < 2.2 × 10⁻¹⁶. Boxplots represent the median, 25th percentile and 75th percentile of the data, and whiskers represent the highest and lowest values within 1.5 times the interquartile range of the boxplot.
(D) Bar plot showing the proportion of peak-to-gene linkages where both peak and gene were validated by a multi-tissue dataset of activity-by-contact (ABC) model enhancer-gene predictions. Categories compared included the space of all possible peak-to-gene links, the mean of 100 permutations drawn from all possible peak-to-gene links where for each permutation 146,088 peaks were selected to match the anchor distance distribution of true peak-to-gene links, and the set of true peak-to-gene links identified on each sub-clustered dataset. Hypergeometric enrichment tests comparing each subgroup of true peak-to-gene links to the mean distance-matched background set, p < 2.2 × 10⁻¹⁶.
(E) Venn-diagram indicating the overlap of peak-to-gene linkages and peak-to-nearest-gene associations.
(F) Comparison of the linked peak score (sum of accessibility at linked peaks) compared to the gene activity score for predicting gene expression for the 1739 HRGs. Plotted is the Pearson R2 from 246 pseudo-bulked samples per gene. Boxplots represent the median, 25th percentile and 75th percentile of the data, and whiskers represent the highest and lowest values within 1.5 times the interquartile range of the boxplot.
