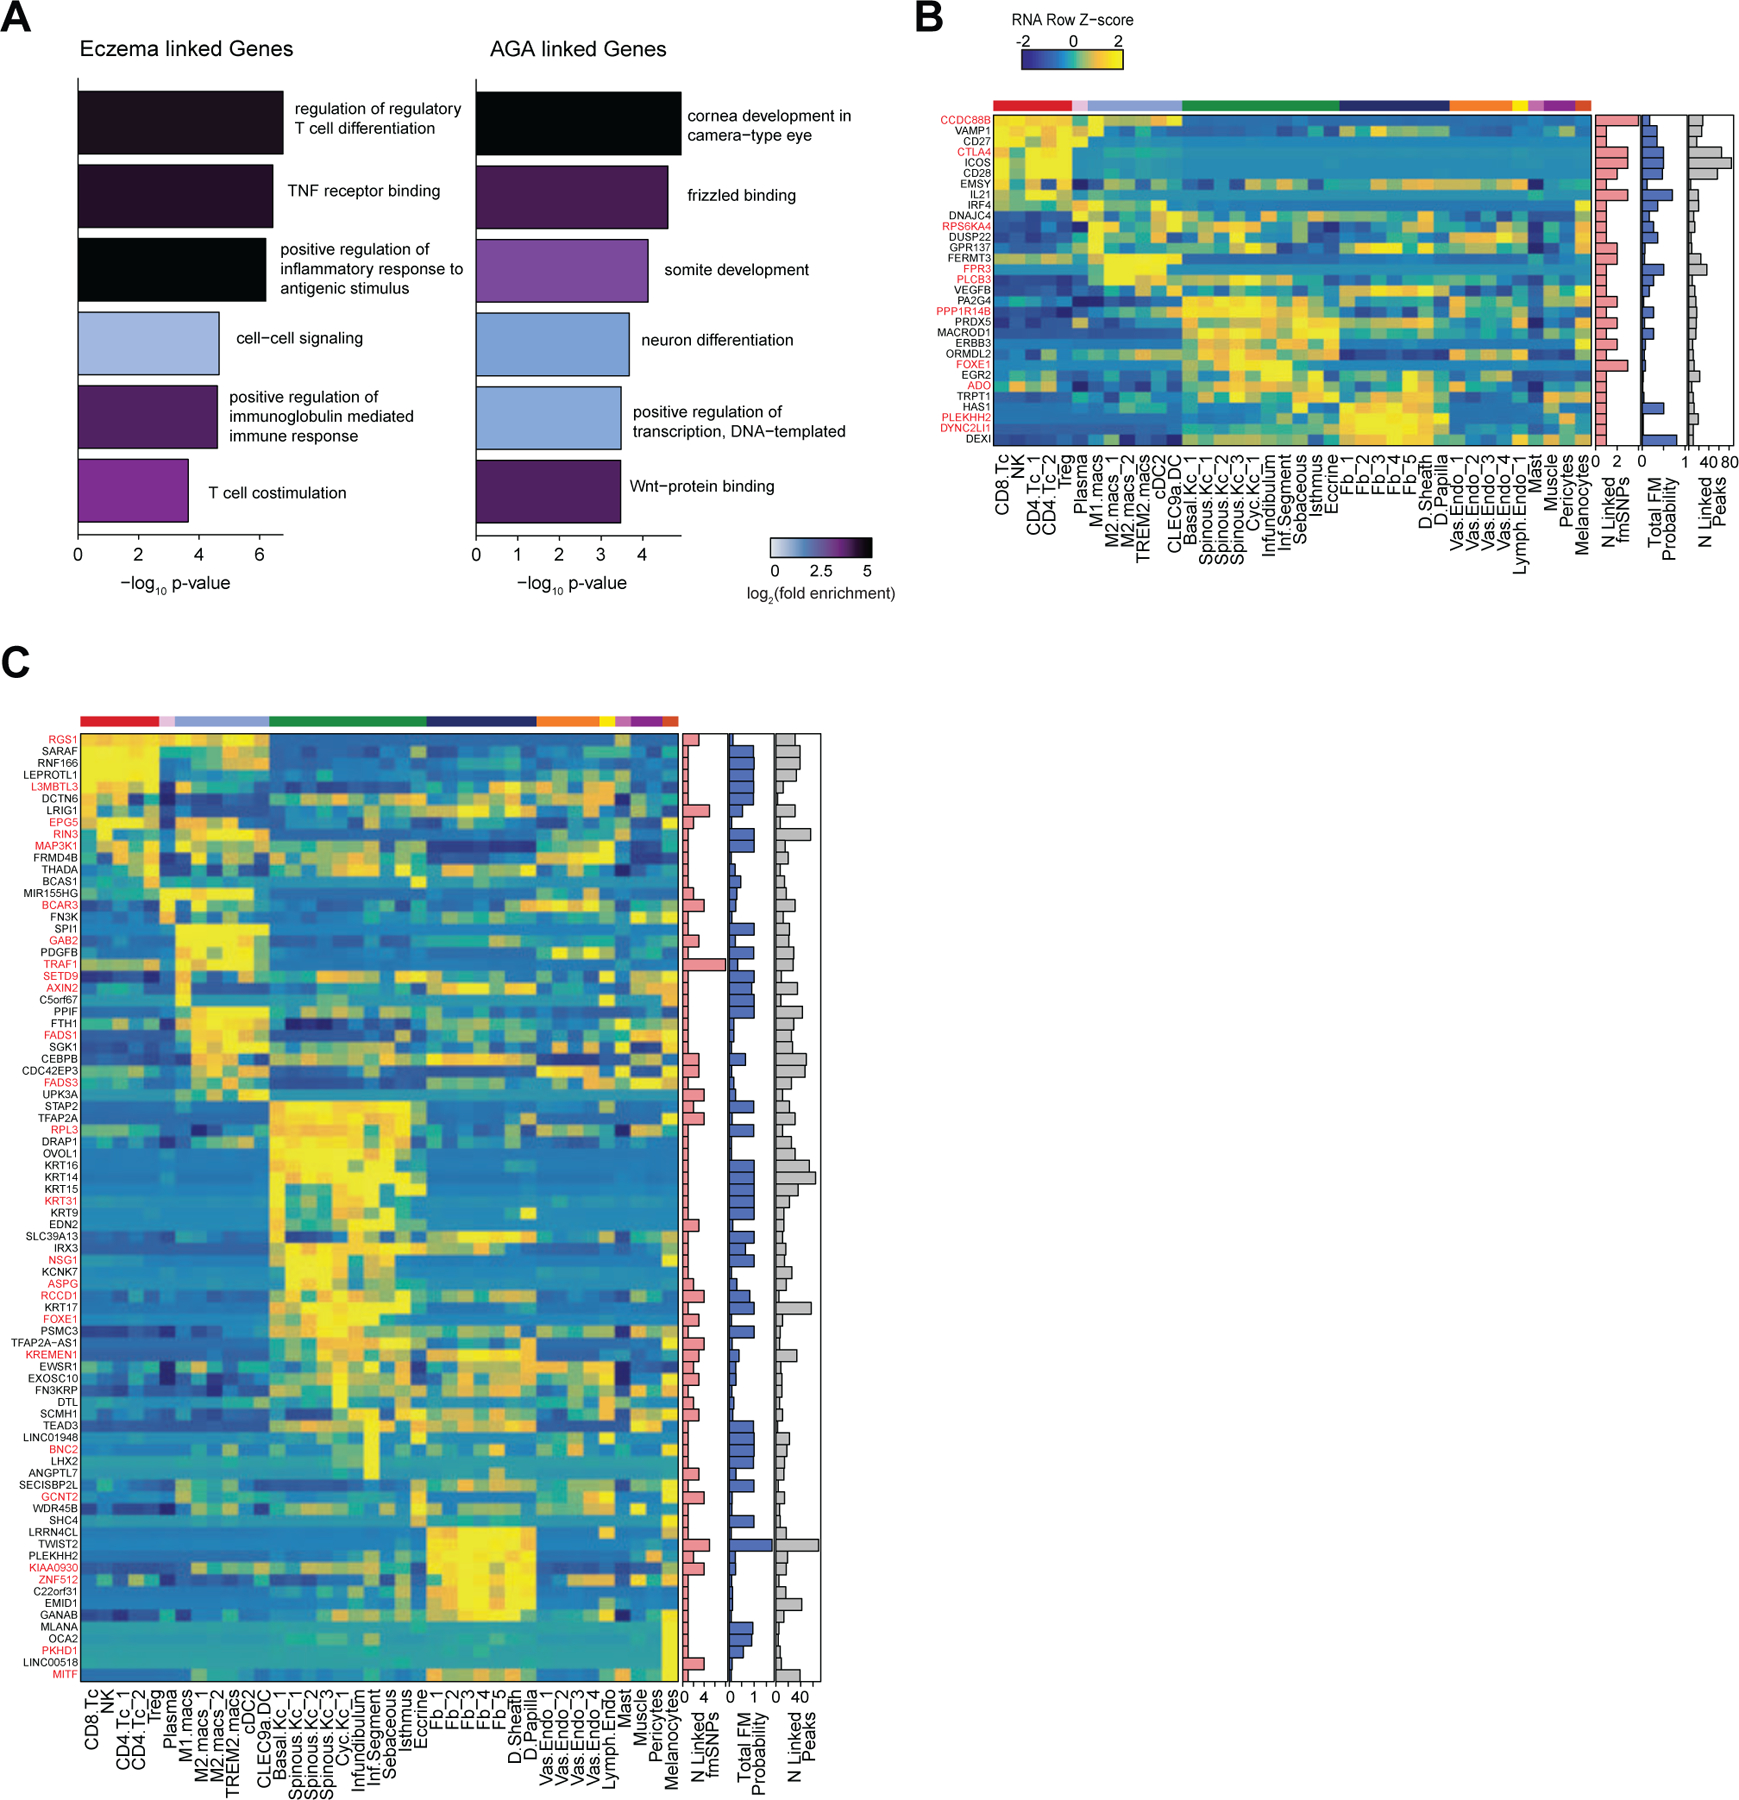
Extended Data Fig. 9 |. Supplemental analyses of fmGWAS-linked genes. Related to Figure 5.

(A) GO term enrichment for the top genes linked to fine-mapped SNPs by summed fine-mapping posterior probability in associated peak-to-gene linkages.
(B) The top genes linked to peaks containing fine-mapped SNPs for alopecia areata. The heatmap shows relative gene expression for each high-resolution scRNA cluster. The number of linked fmSNPs per gene is indicated in the red bar plot to the right, and the total sum of fine-mapped posterior probability for linked SNPs is indicated in the blue bar plot. The grey bar plot shows the total number of identified peak-to-gene linkages for that gene in the entire scalp dataset. Gene names colored red indicate fine-mapped SNP to gene linkages supported by GTEx eQTLs.
(C) Same as in (B), but for hair color.
