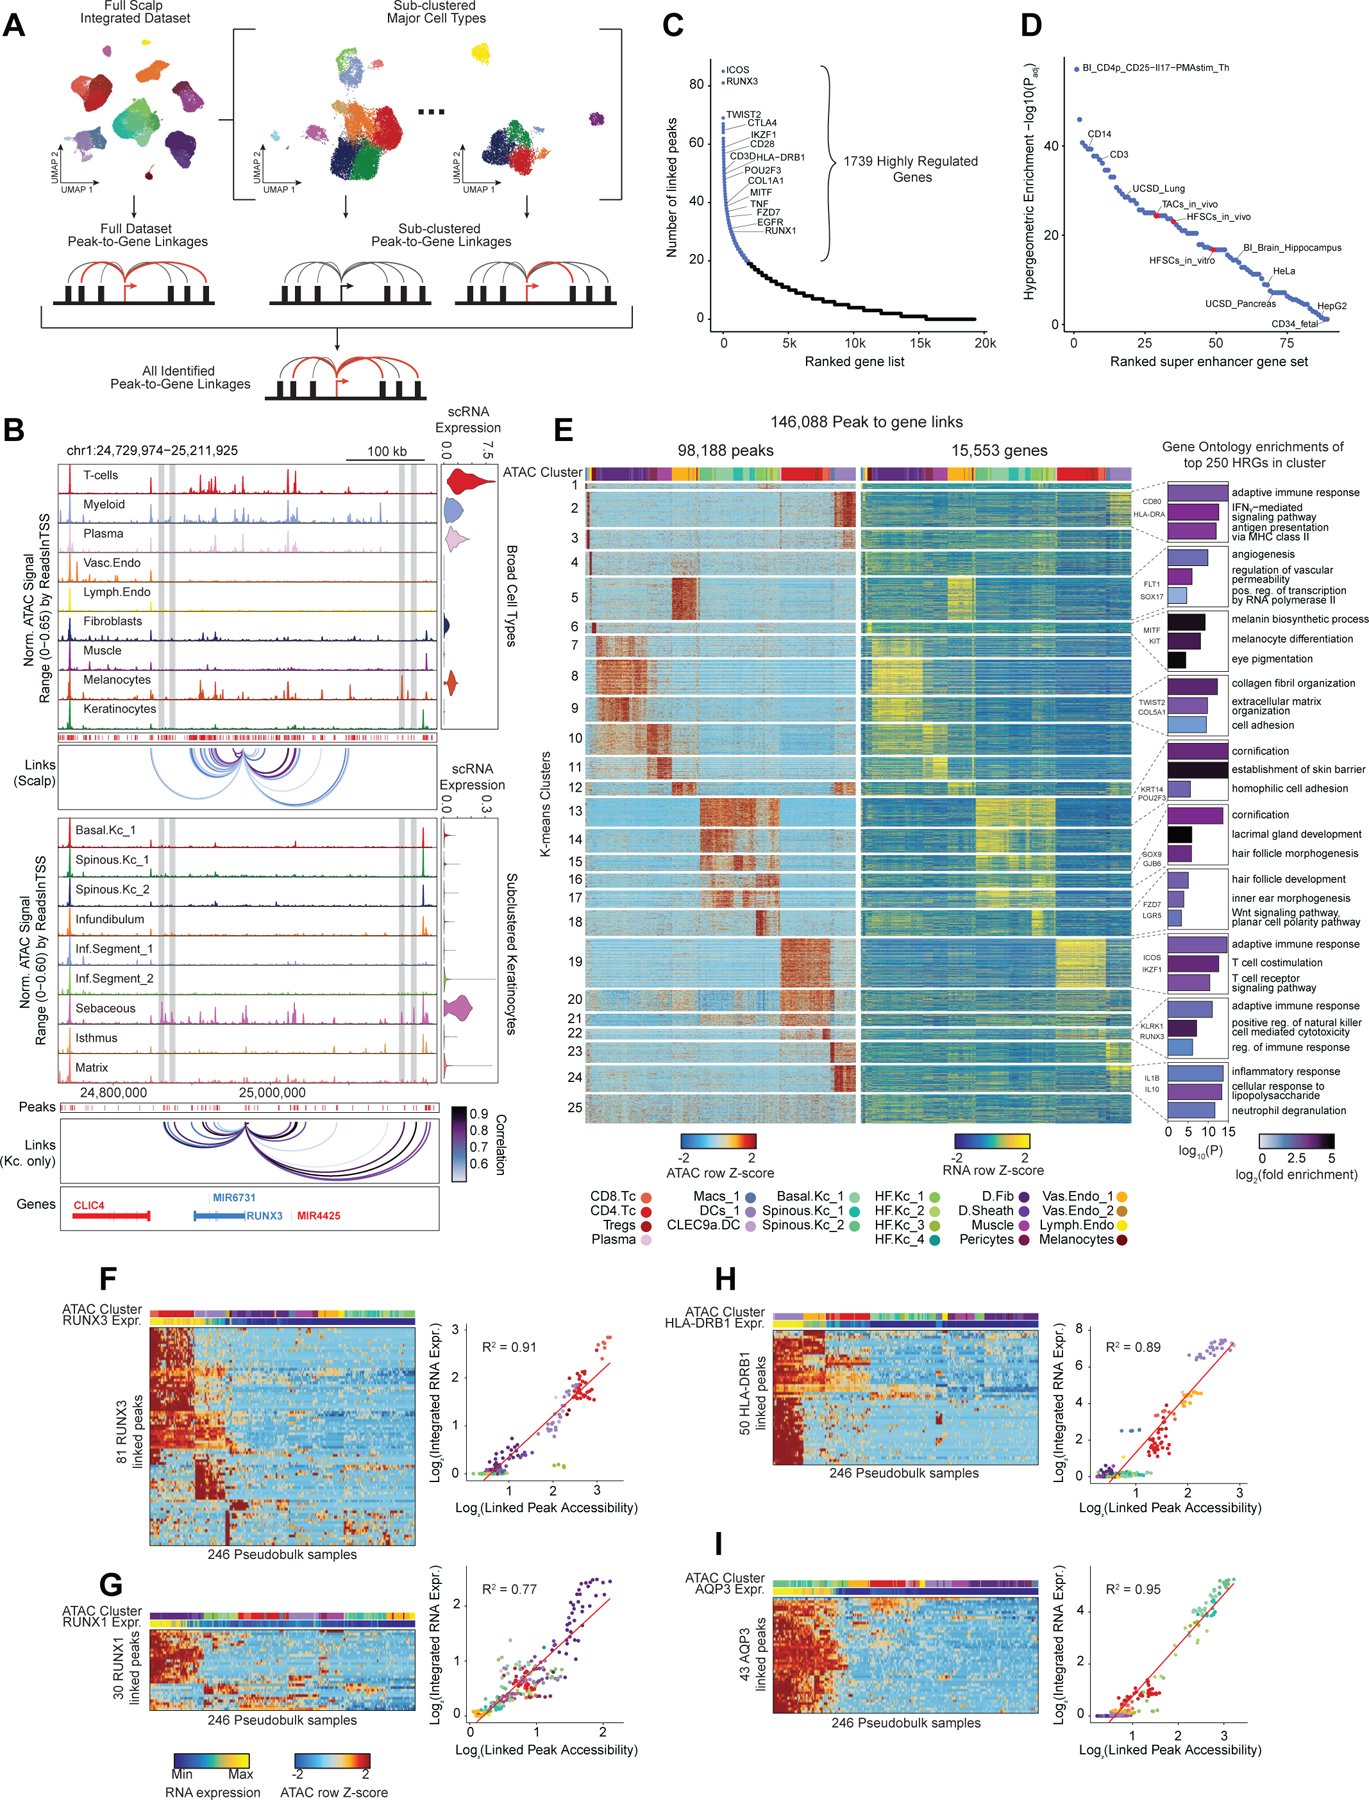
Figure 2 |. Gene regulatory dynamics and modularity in human scalp.

(A) Peak-to-gene linkages were identified on the integrated scATAC and scRNA full scalp dataset, and on each of the five major cell type sub-clustered datasets. Peak-to-gene linkages identified in each dataset are merged to form the full set of peak-to-gene linkages.
(B) Genomic tracks for accessibility around RUNX3 for different cell types. Integrated RUNX3 expression levels are shown in the violin plot for each cell type to the right. Loops shown below the top panel indicate peak-to-gene linkages identified on the full integrated dataset. Lower panel shows the genomic tracks for accessibility around RUNX3 for sub-clustered keratinocytes. Loops shown below these tracks indicate peak-to-gene linkages identified on the sub-clustered dataset. The gray vertical bars spanning both panels highlight select peaks linked to RUNX3 expression identified in the sub-clustered keratinocytes that were not identified using the full integrated dataset.
(C) Genes ranked by the number of peak-to-gene links identified for each gene. 1739 ‘highly regulated genes’ (HRGs) had > 20 peak-to-gene linkages.
(D) Hypergeometric enrichment of super-enhancer linked genes in human scalp HRGs for each cell and tissue type profiled in Hnisz et al. 2013. Red dots represent enrichment of the human homolog of mouse hair-follicle super-enhancer linked genes identified in Adam et al. 2015.
(E) Heatmap showing the chromatin accessibility (left) and gene expression (right) for the 146,088 peak-to-gene linkages. Peak-to-gene linkages were clustered using k-means clustering (k = 25). Sample top HRGs for select clusters are shown to the right of the gene expression heatmap. GO term enrichments for the top 200 genes ranked by number of peak-to-gene linkages are shown to the right for select k-means clusters.
(F) Heatmap showing chromatin accessibility at RUNX3-linked peaks for 246 pseudo-bulked scATAC-seq samples. Cell type labels are shown in the bar above the heatmap, and RUNX3 expression levels for each pseudo-bulk are shown below. Scatter plot to the right shows the relationship between linked peak accessibility and resulting gene expression for each of the pseudo-bulked samples shown in the heatmap to the left.
(G) Same as in (F), but for RUNX1.
(H) Same as in (F), but for HLA-DRB1.
(I) Same as in (F), but for AQP3.
