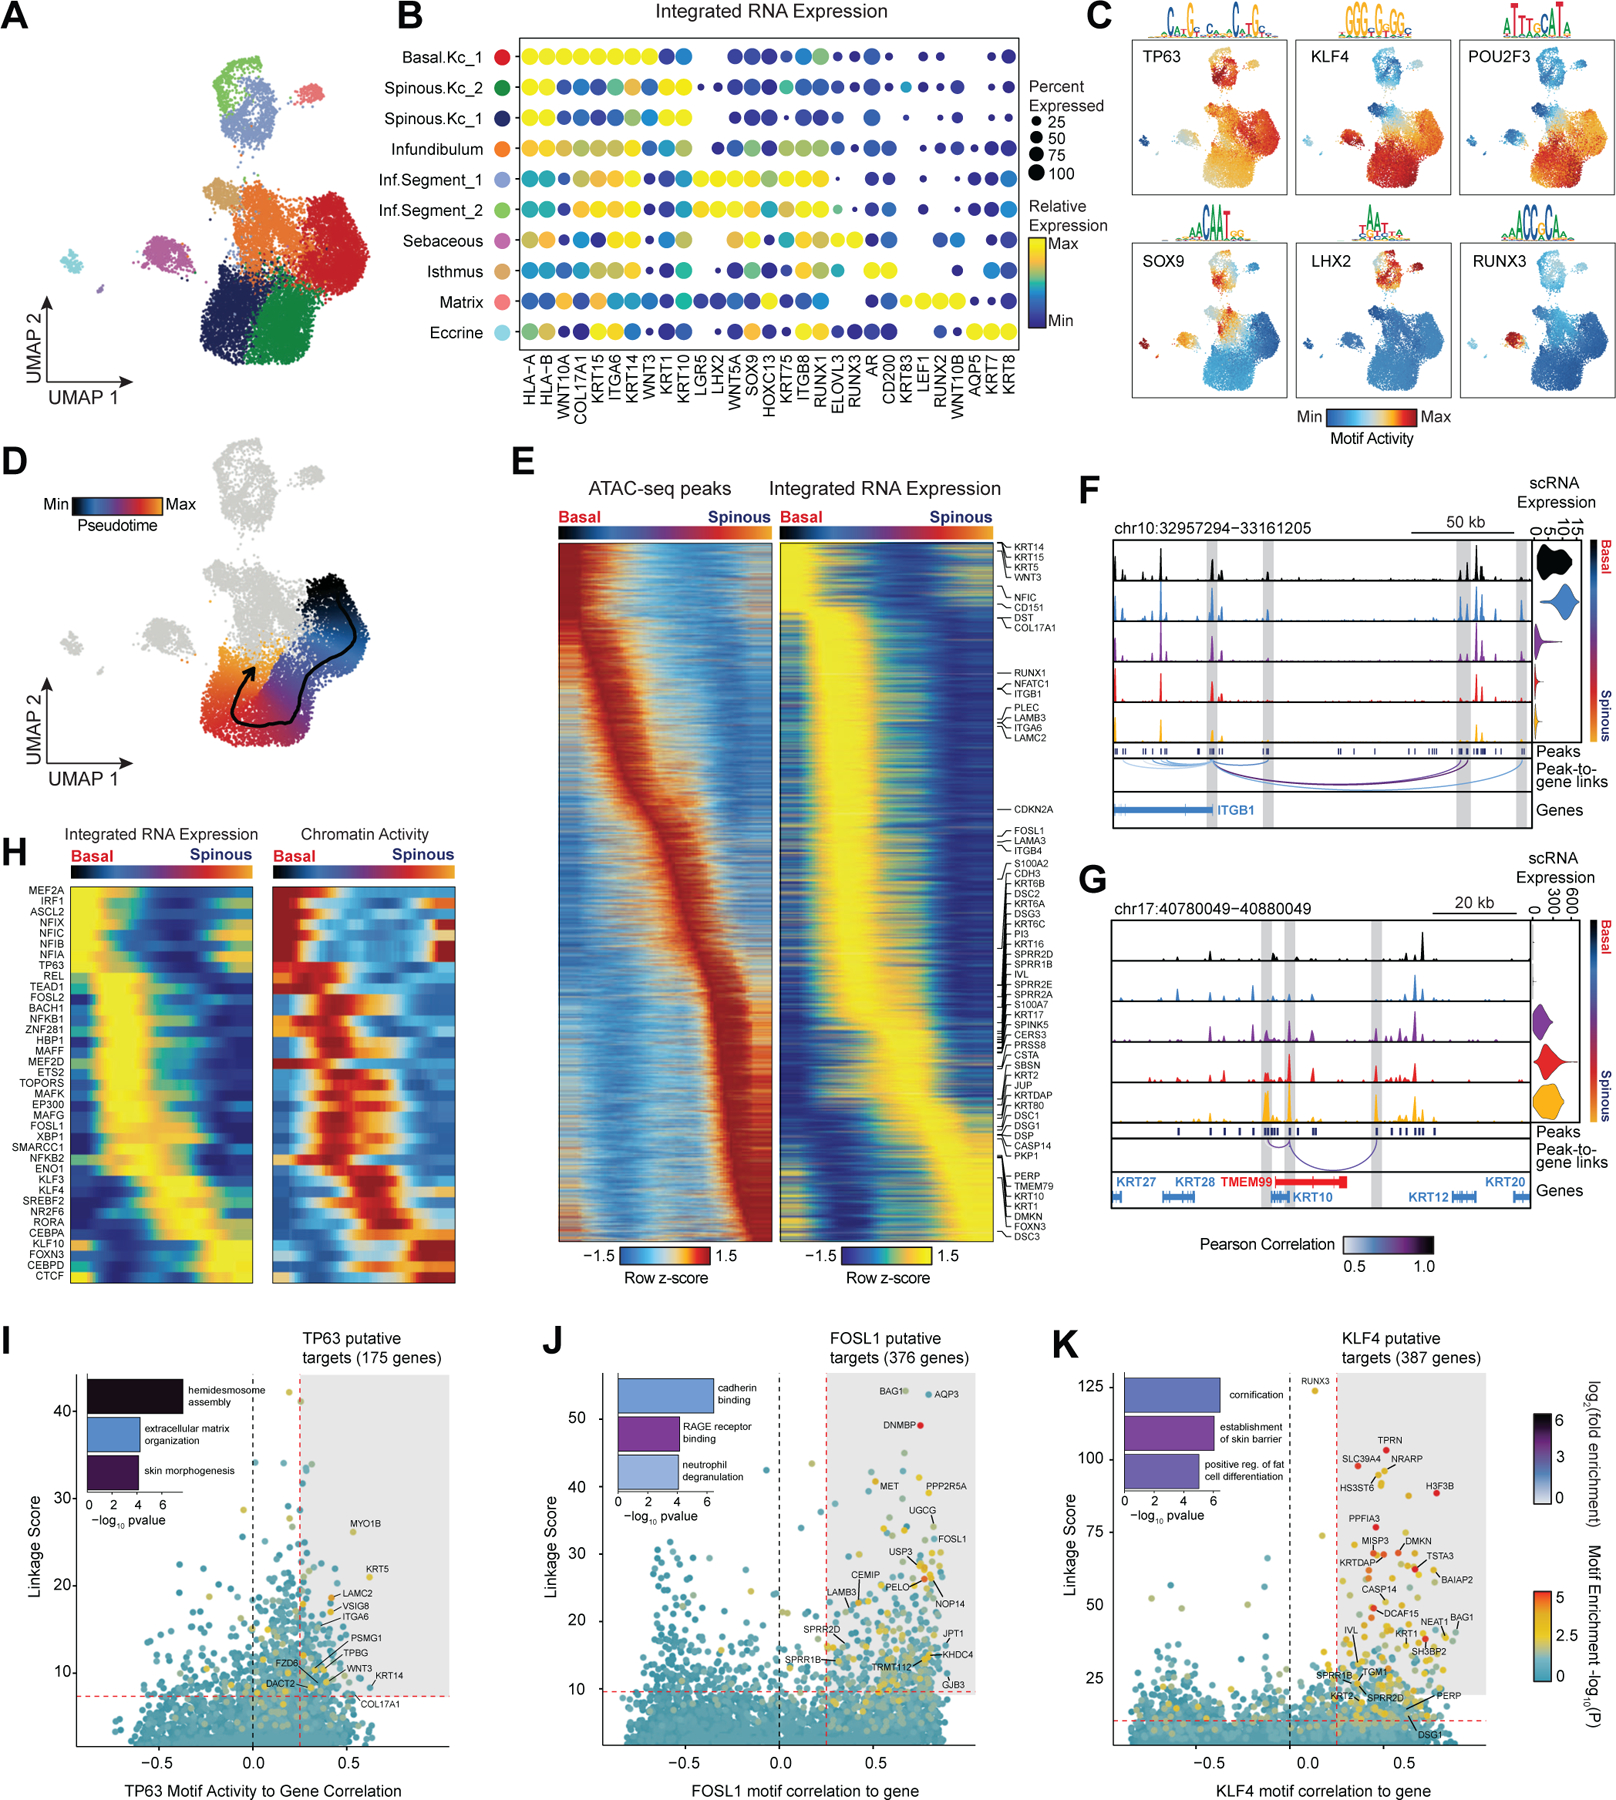
Figure 3 |. Scalp keratinocyte diversity and regulatory control of interfollicular keratinocyte differentiation.

(A) UMAP representation of subclustered keratinocytes in the scATAC-seq dataset
(B) Integrated gene expression for select markers across keratinocyte subtypes. The color indicates the relative expression across all clusters and the size of the dot indicates the percentage of cells in that cluster that express the gene.
(C) ChromVAR deviation z-scores showing transcription factor motif activity for select transcription factors.
(D) Slingshot differentiation trajectory starting with basal interfollicular keratinocytes and progressing to upper layer spinous keratinocytes.
(E) Heatmap of 10% most variable peaks (n = 31,333) and 10% most variable genes (n = 2,127) along the trajectory from basal to spinous keratinocytes.
(F) Genomic tracks of accessibility around the ITGB1 promoter. Tracks are pseudo-bulked samples ordered along the interfollicular differentiation trajectory. Integrated ITGB1 expression levels are shown in the violin plot for each pseudo-bulk to the right.
(G) Same as in (F), but for the KRT10 promoter.
(H) Paired heatmaps of positive TF regulators whose TF motif activity (left) and matched gene expression (right) are positively correlated across the interfollicular keratinocyte differentiation pseudotime trajectory.
(I) Prioritization of gene targets for TP63. The x-axis shows the Pearson correlation between the TF motif activity and integrated gene expression for all expressed genes across all keratinocytes. The y-axis shows the TF Linkage Score (for all linked peaks, sum of motif score scaled by peak-to-gene link correlation). Color of points indicates the hypergeometric enrichment of the TF motif in all linked peaks for each gene. Top gene targets are indicated in the shaded area (motif correlation to gene expression >0.25, linkage score >80th percentile). GO term enrichments for the top gene targets are shown in the inset bar plot.
(J) Same as in (I), but for FOSL1.
(K) Same as in (I), but for KLF4.
