
FIGURE 2.
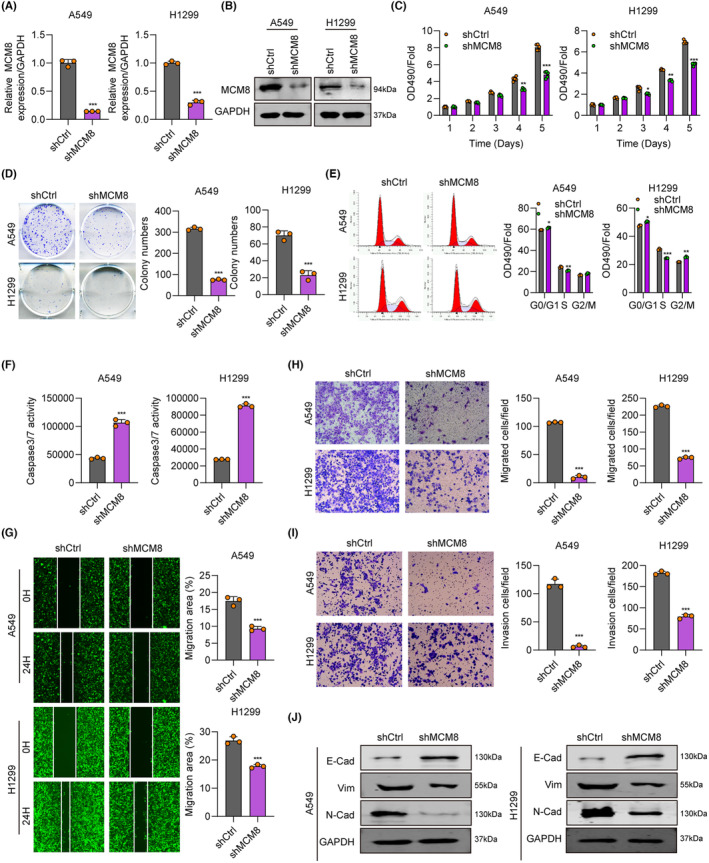
Silencing of MCM8 suppresses cell proliferation and migration. (A, B) MCM8 knockdown efficiency in LC cells evaluated by RT‐qPCR and western blot. (C) Cell proliferation rate after MCM8 knockdown evaluated by MTT assay. (D) LC cell colony numbers after MCM8 knockdown analysed by cell colony formation assay. (E) Cell cycle analysis by flow cytometry after MCM8 knockdown. (F) Apoptosis after MCM8 knockdown, determined by assessing Caspase 3/7 activity. (G) Cell migration in shCtrl‐ and shMCM8‐treated cells, determined by wound‐healing assay. (H, I) Cell migration and invasion in shCtrl‐ and shMCM8‐treated cells, determined by transwell assay. (J) N‐cadherin, E‐cadherin, and Vimentin expression after MCM8 knockdown, detected by western blot. *p < 0.05, **p < 0.01, ***p < 0.001.