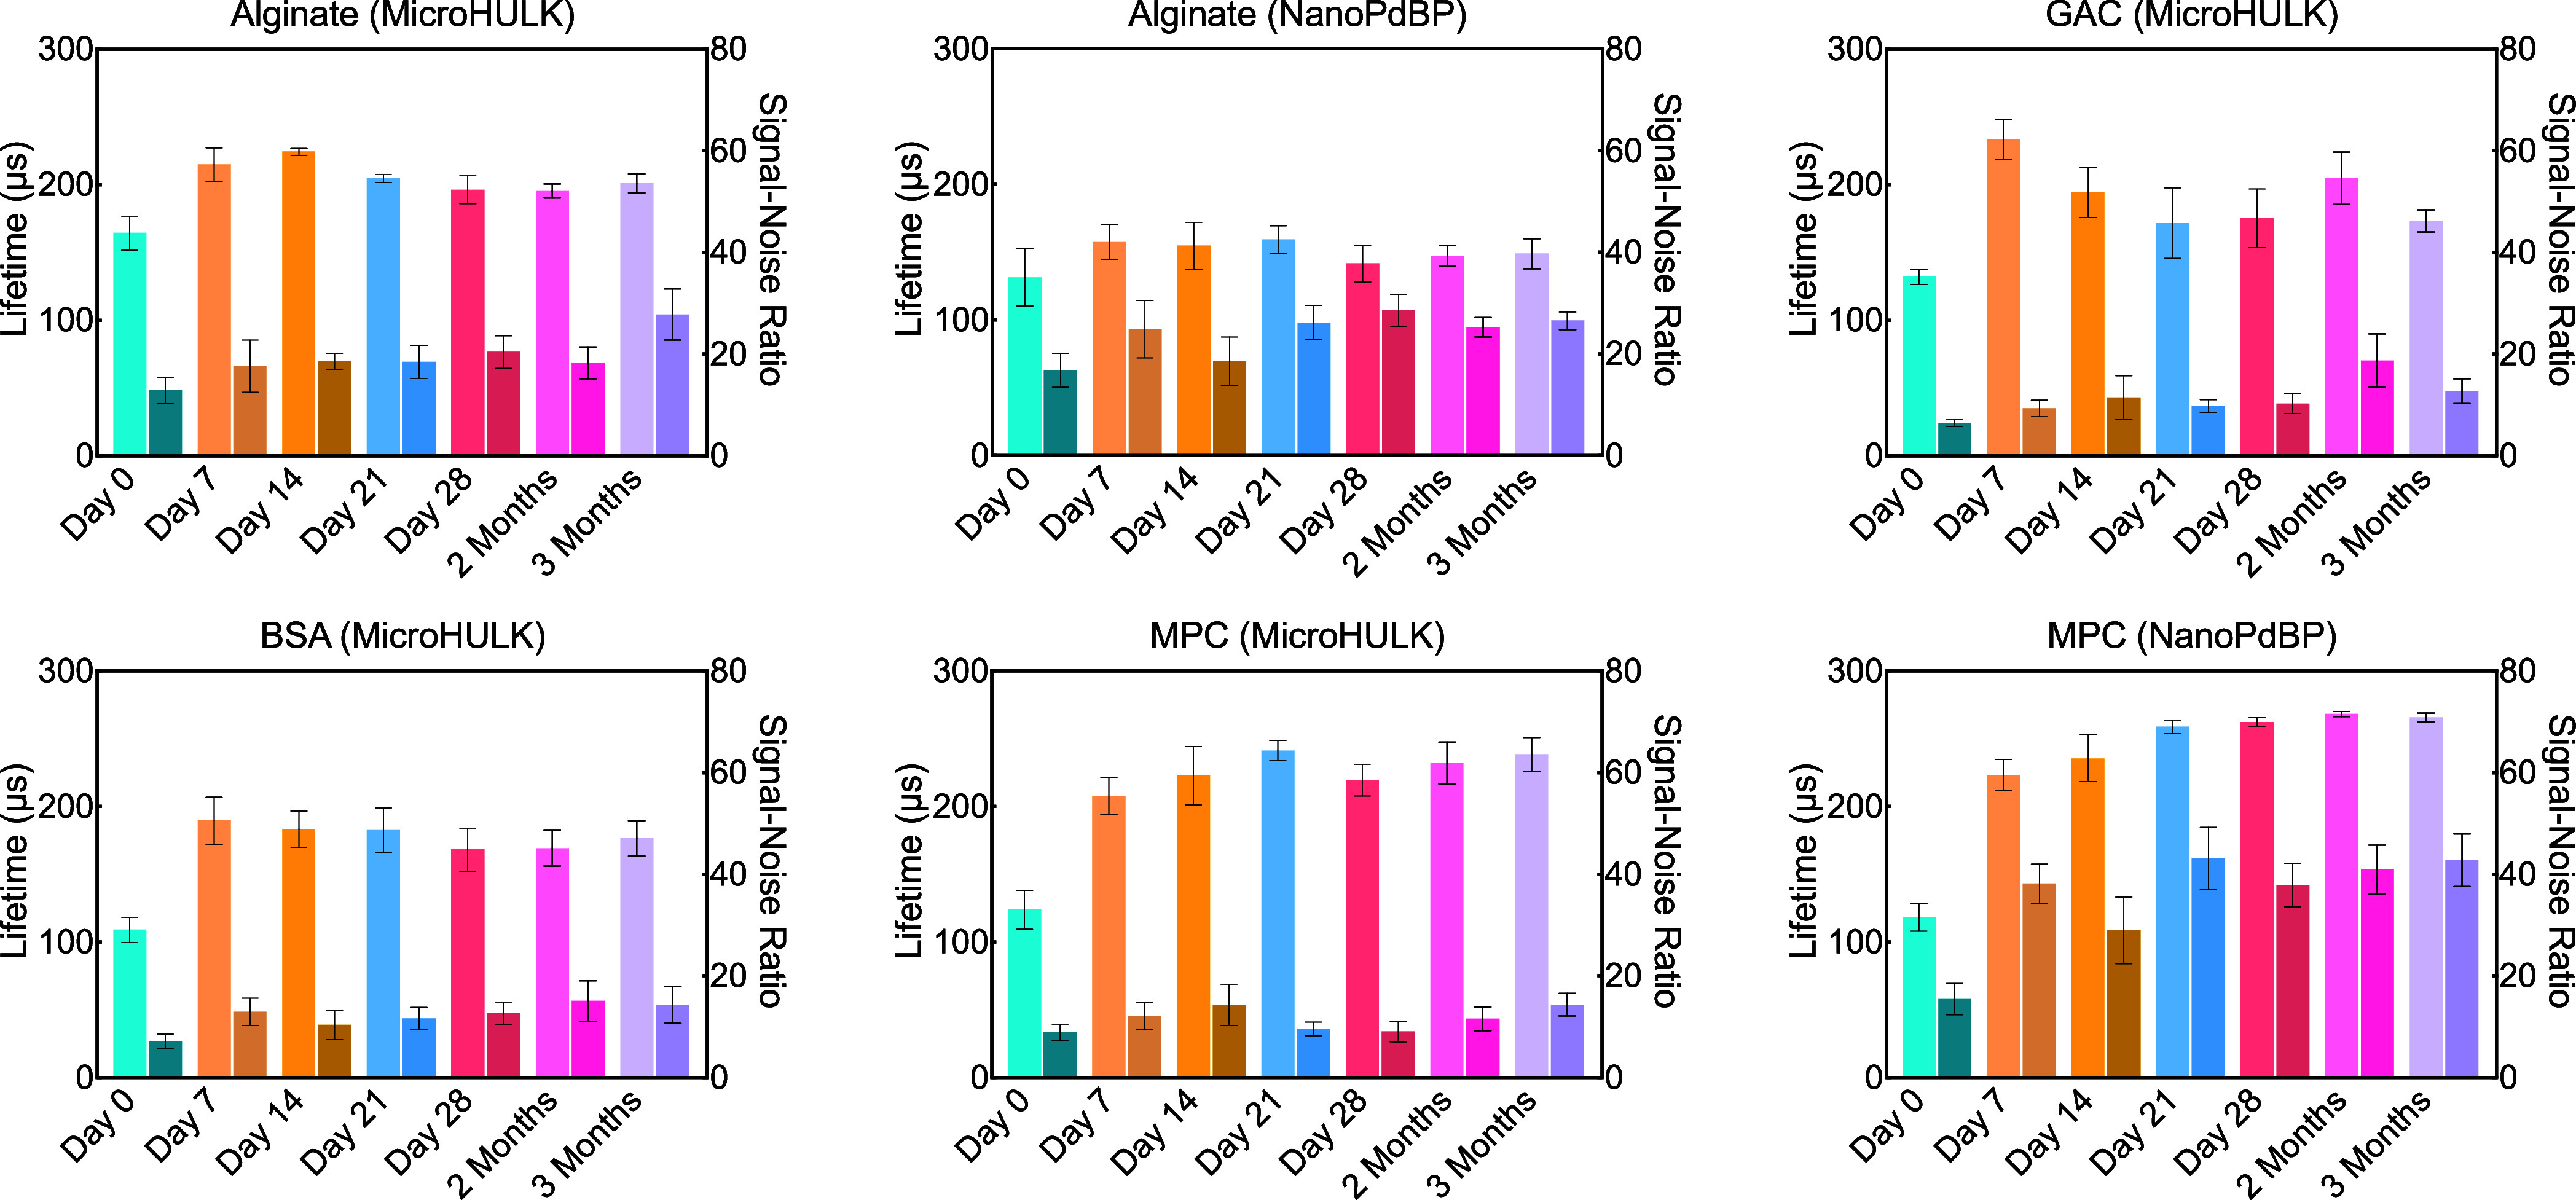
Figure 5.

Primary sample lifetime and SNR. Averaged lifetimes are in microseconds for each material type tested. Signal to noise ratios are shown in the darker bars to the right of the primary bars. Results indicated that after the first day, lifetime data and signal strength retained consistent levels, particularly where signal strength was the strongest, and that the implants functioned in vivo as expected out to 3 months postimplantation.
