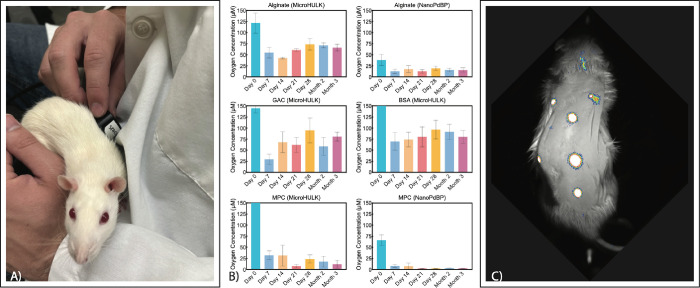
Figure 6.
Results of in vivo oxygen evaluation. (A) Postsurgical oxygen monitoring of the implantable oxygen monitors. The reader heads are gently placed against the unrestrained rat’s skin. The excitatory red LED causes the phosphors to emit an infrared light for some microseconds. (B) Interstitial oxygen concentrations in micromoles, calculated by calibrating in vivo lifetime measurements to in vitro oxygen calibration data. (C) Qualitative visualization of the subcutaneous implants after 3 months in vivo, demonstrating the durability of the signal from implanted sensors.

