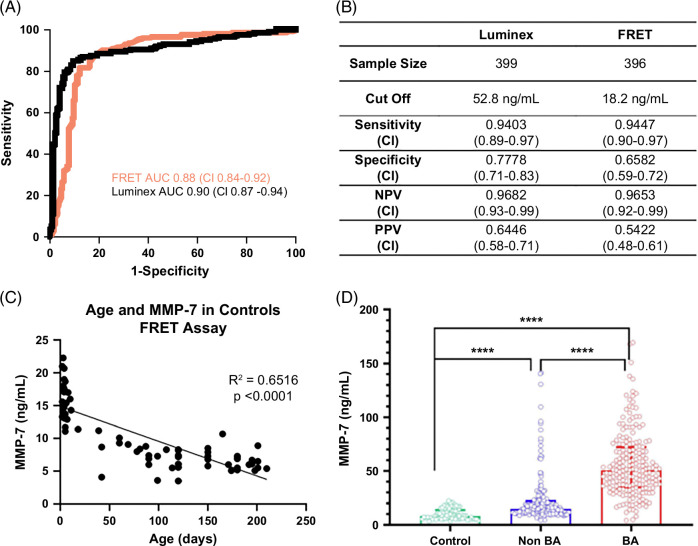
FIGURE 4.
ROC curves for TR-FRET and Luminex assays. (A) Superimposed ROC curves for the Luminex assay (black line) and TR-FRET assay (red line). (B) The table on the right displays the AUROCs of Luminex and TR-FRET assays, along with sensitivity, specificity, NPV, and PPV calculated at each respective cutoff point. (C) Scatter plots show simple logistic regression analysis of MMP-7 concentration and postnatal age in days in healthy controls using the TR-FRET assay. (D) Graphs display the median and IQR of MMP-7 concentrations in healthy controls, non-BA cholestasis, and BA using TR-FRET assays. Abbreviations: BA, biliary atresia; FRET, fluorescence energy transfer; MMP-7, matrix metalloproteinase-7.

