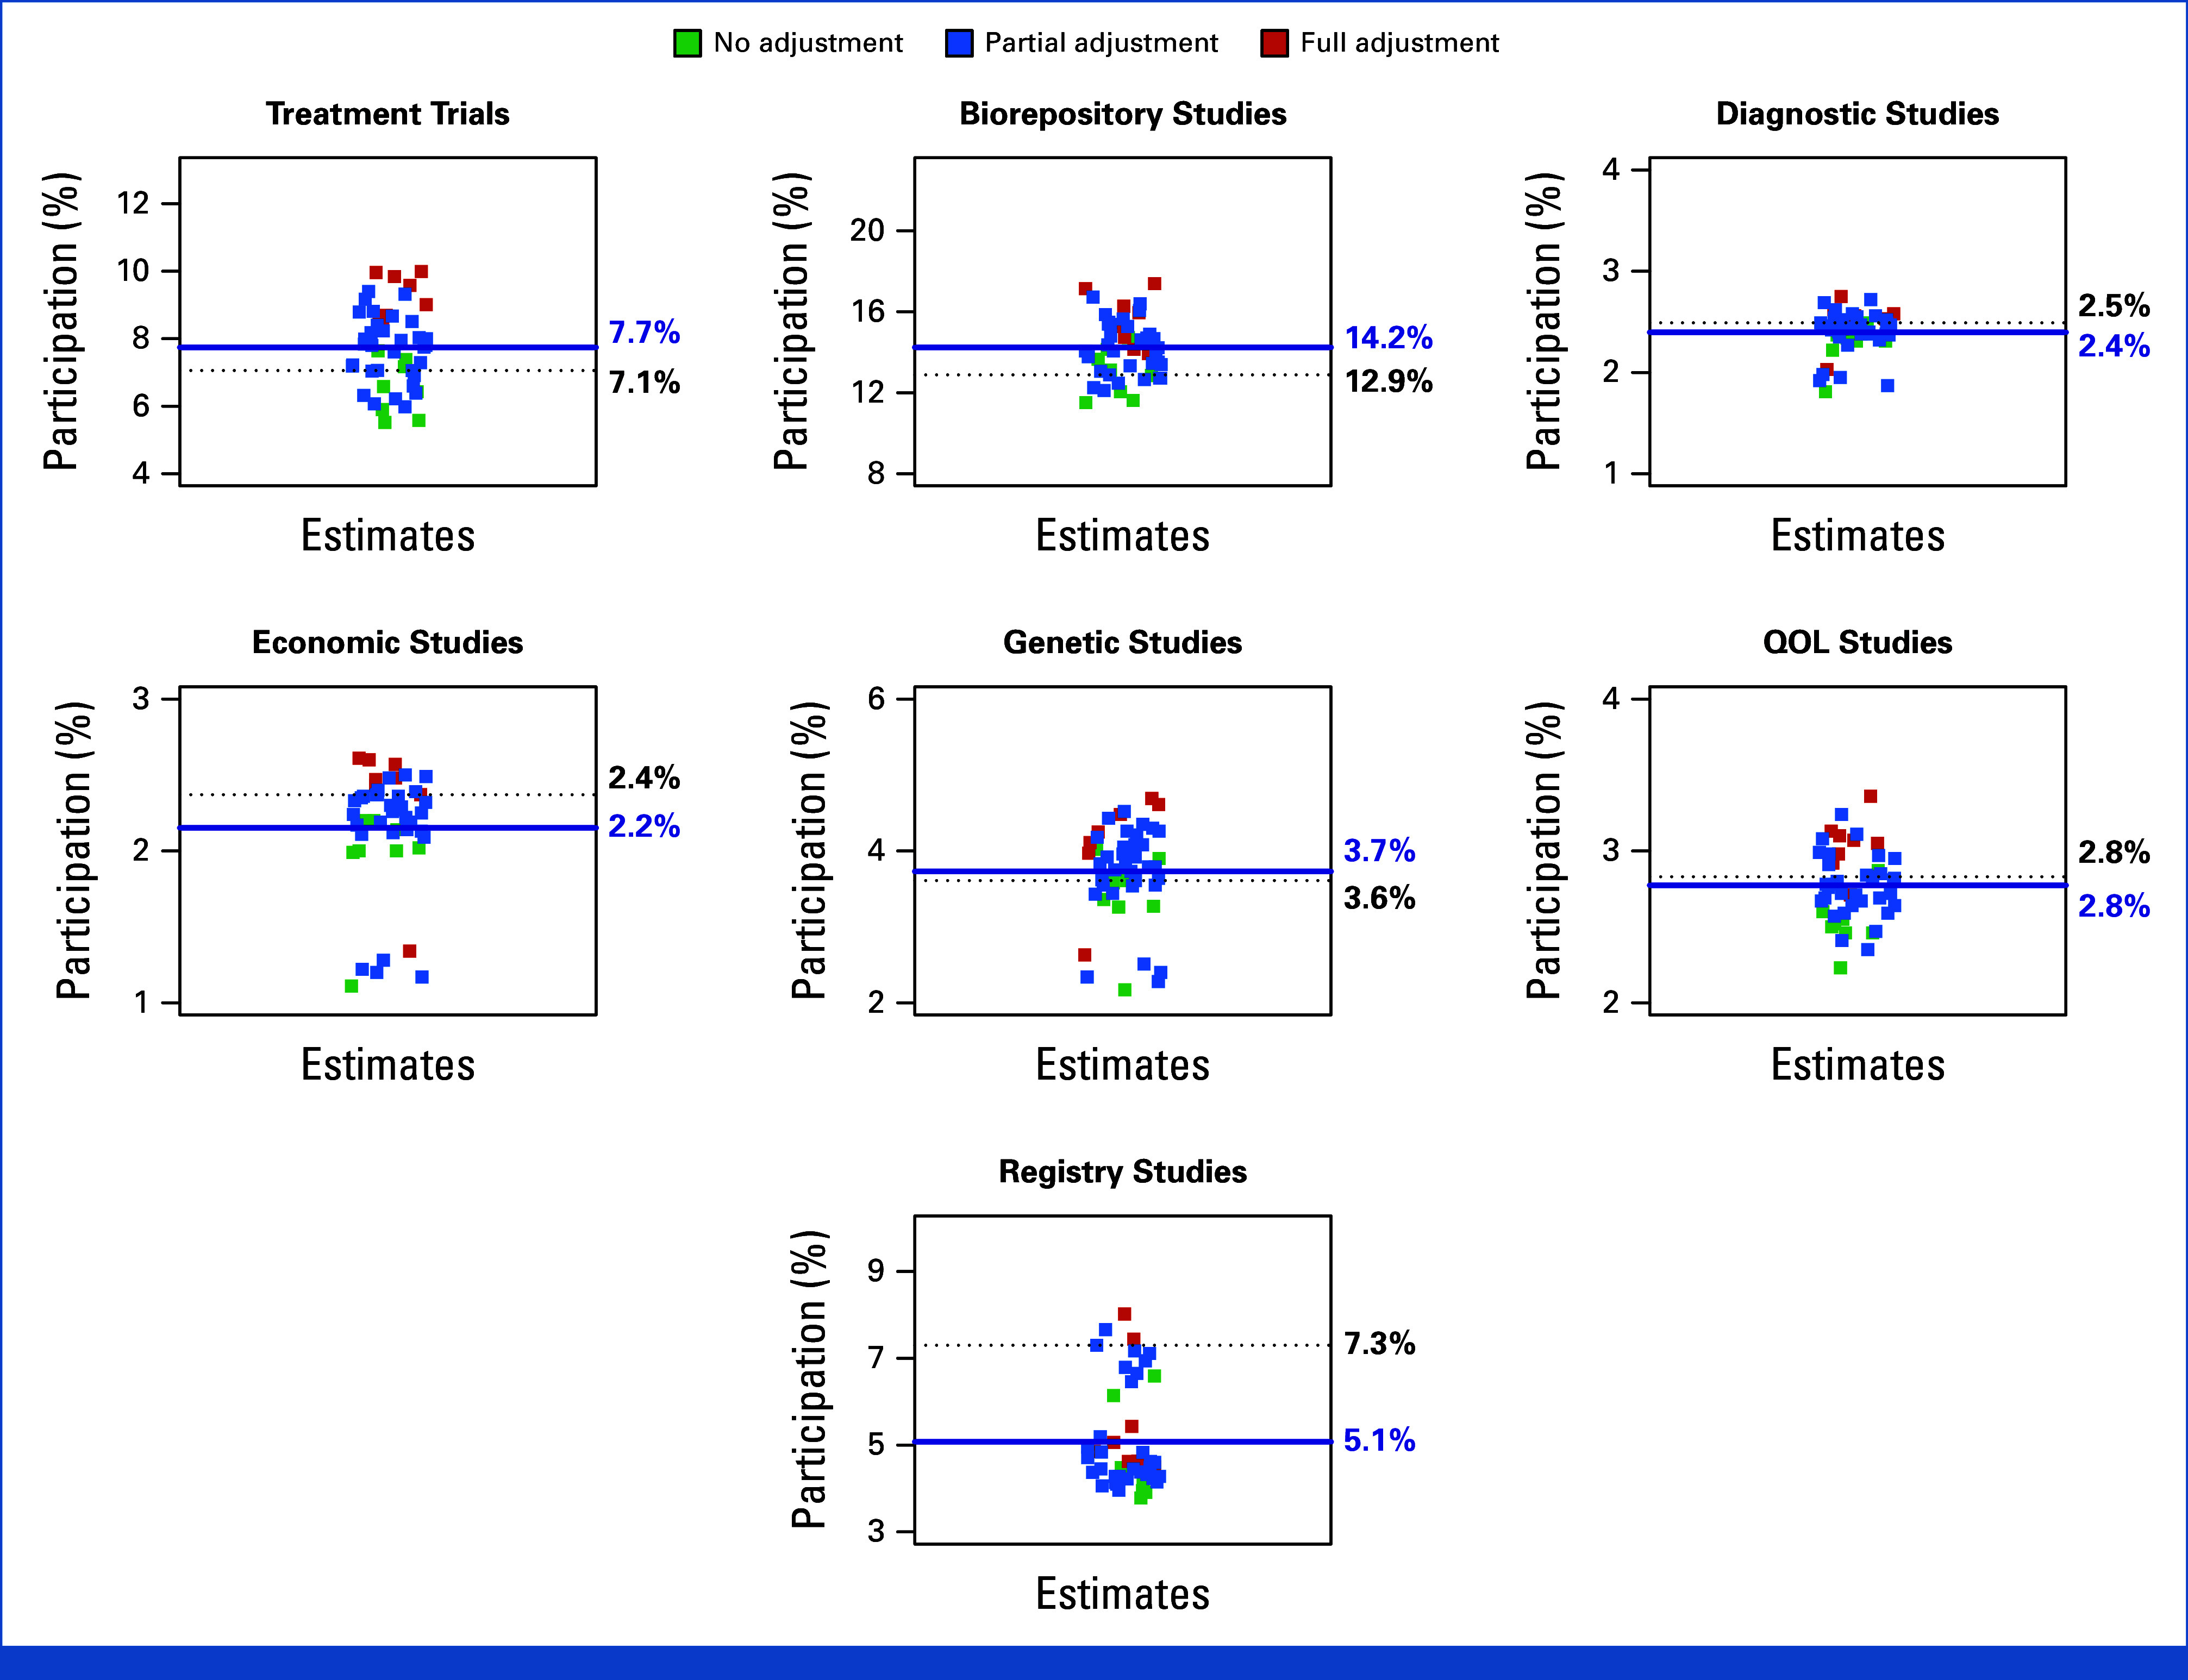
FIG 4.

Sensitivity analyses. Estimates were allowed to vary depending on the proportion of enrollments from studies categorized as other and according to data completeness. With seven study domains, observations may have been missing for zero studies up to all seven studies. Forty-eight total analyses were conducted for each study type. The base case finding is indicated by the horizontal dotted line in black and the mean of the sensitivity analyses is indicated by the horizontal line in blue. The base case versus mean (range) sensitivity analysis estimates were 7.1% versus 7.7% (5.5%-10.0%) for treatment trials, 12.9% versus 14.3% (11.5%-17.4%) for biorepository studies, 2.6% versus 2.4% (1.8%-2.8%) for diagnostic studies, 2.4% versus 2.2% (1.1%-2.6%) for economic studies, 3.7% versus 3.6% (2.2%-4.7%) for genetic studies, 2.8% versus 2.8% (2.2%-3.4%) for QOL studies, and 7.3% versus 5.1% (3.8%-8.0%) for registry studies. QOL, quality-of-life.
