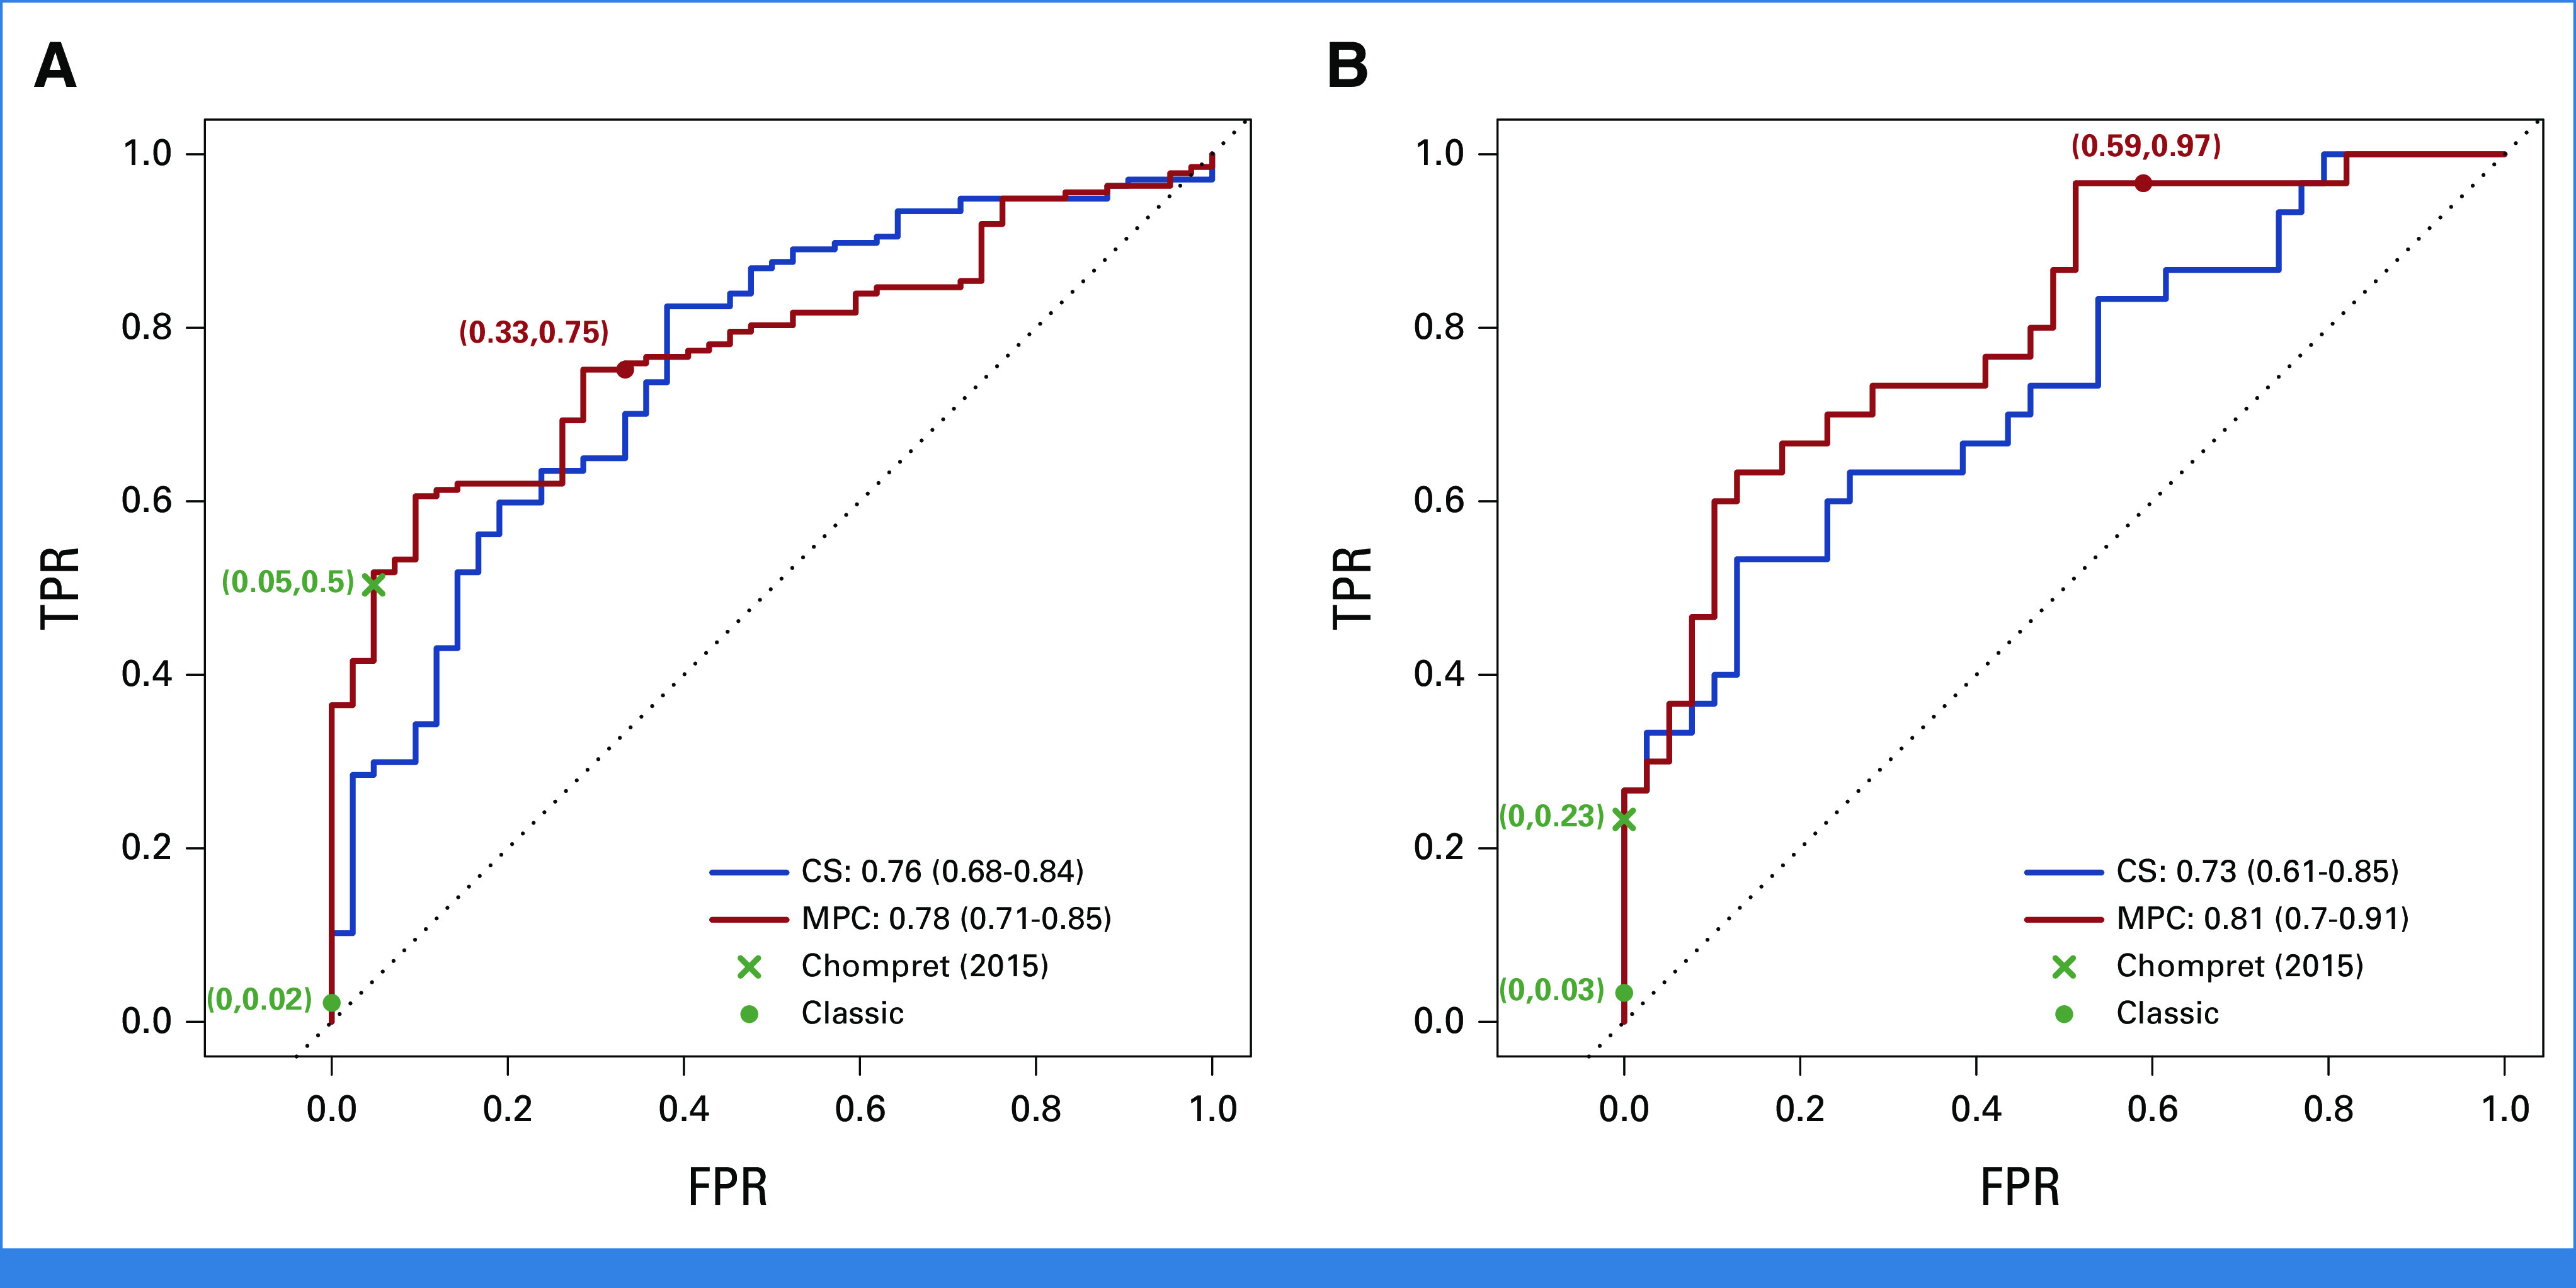
FIG 2.

ROC curves and the 95% bootstrapped CIs of the AUCs for TP53 mutation predictions in the CCG cohort using the CS and MPC models under two scenarios: (A) predict mutations for both the probands and their family members when no genotype information is available and (B) predict mutations for family members given the probands' confirmed genotypes. The TPRs and FPRs of the MPC model at cutoff probability of 0.20, as suggested by validation on research cohorts, are shown in both scenarios. The classic and Chompret criteria are shown for comparison. Sample sizes: (A) n (mutation carriers) = 137, n (wildtypes) = 42 and (B) n (mutation carriers) = 30, n (wildtypes) = 39. CCG, Clinical Cancer Genetics; CS, cancer-specific; FPR, false-positive rate; MPC, multiple primary cancer; ROC, receiver operating characteristic; TPR, true-positive rate.
