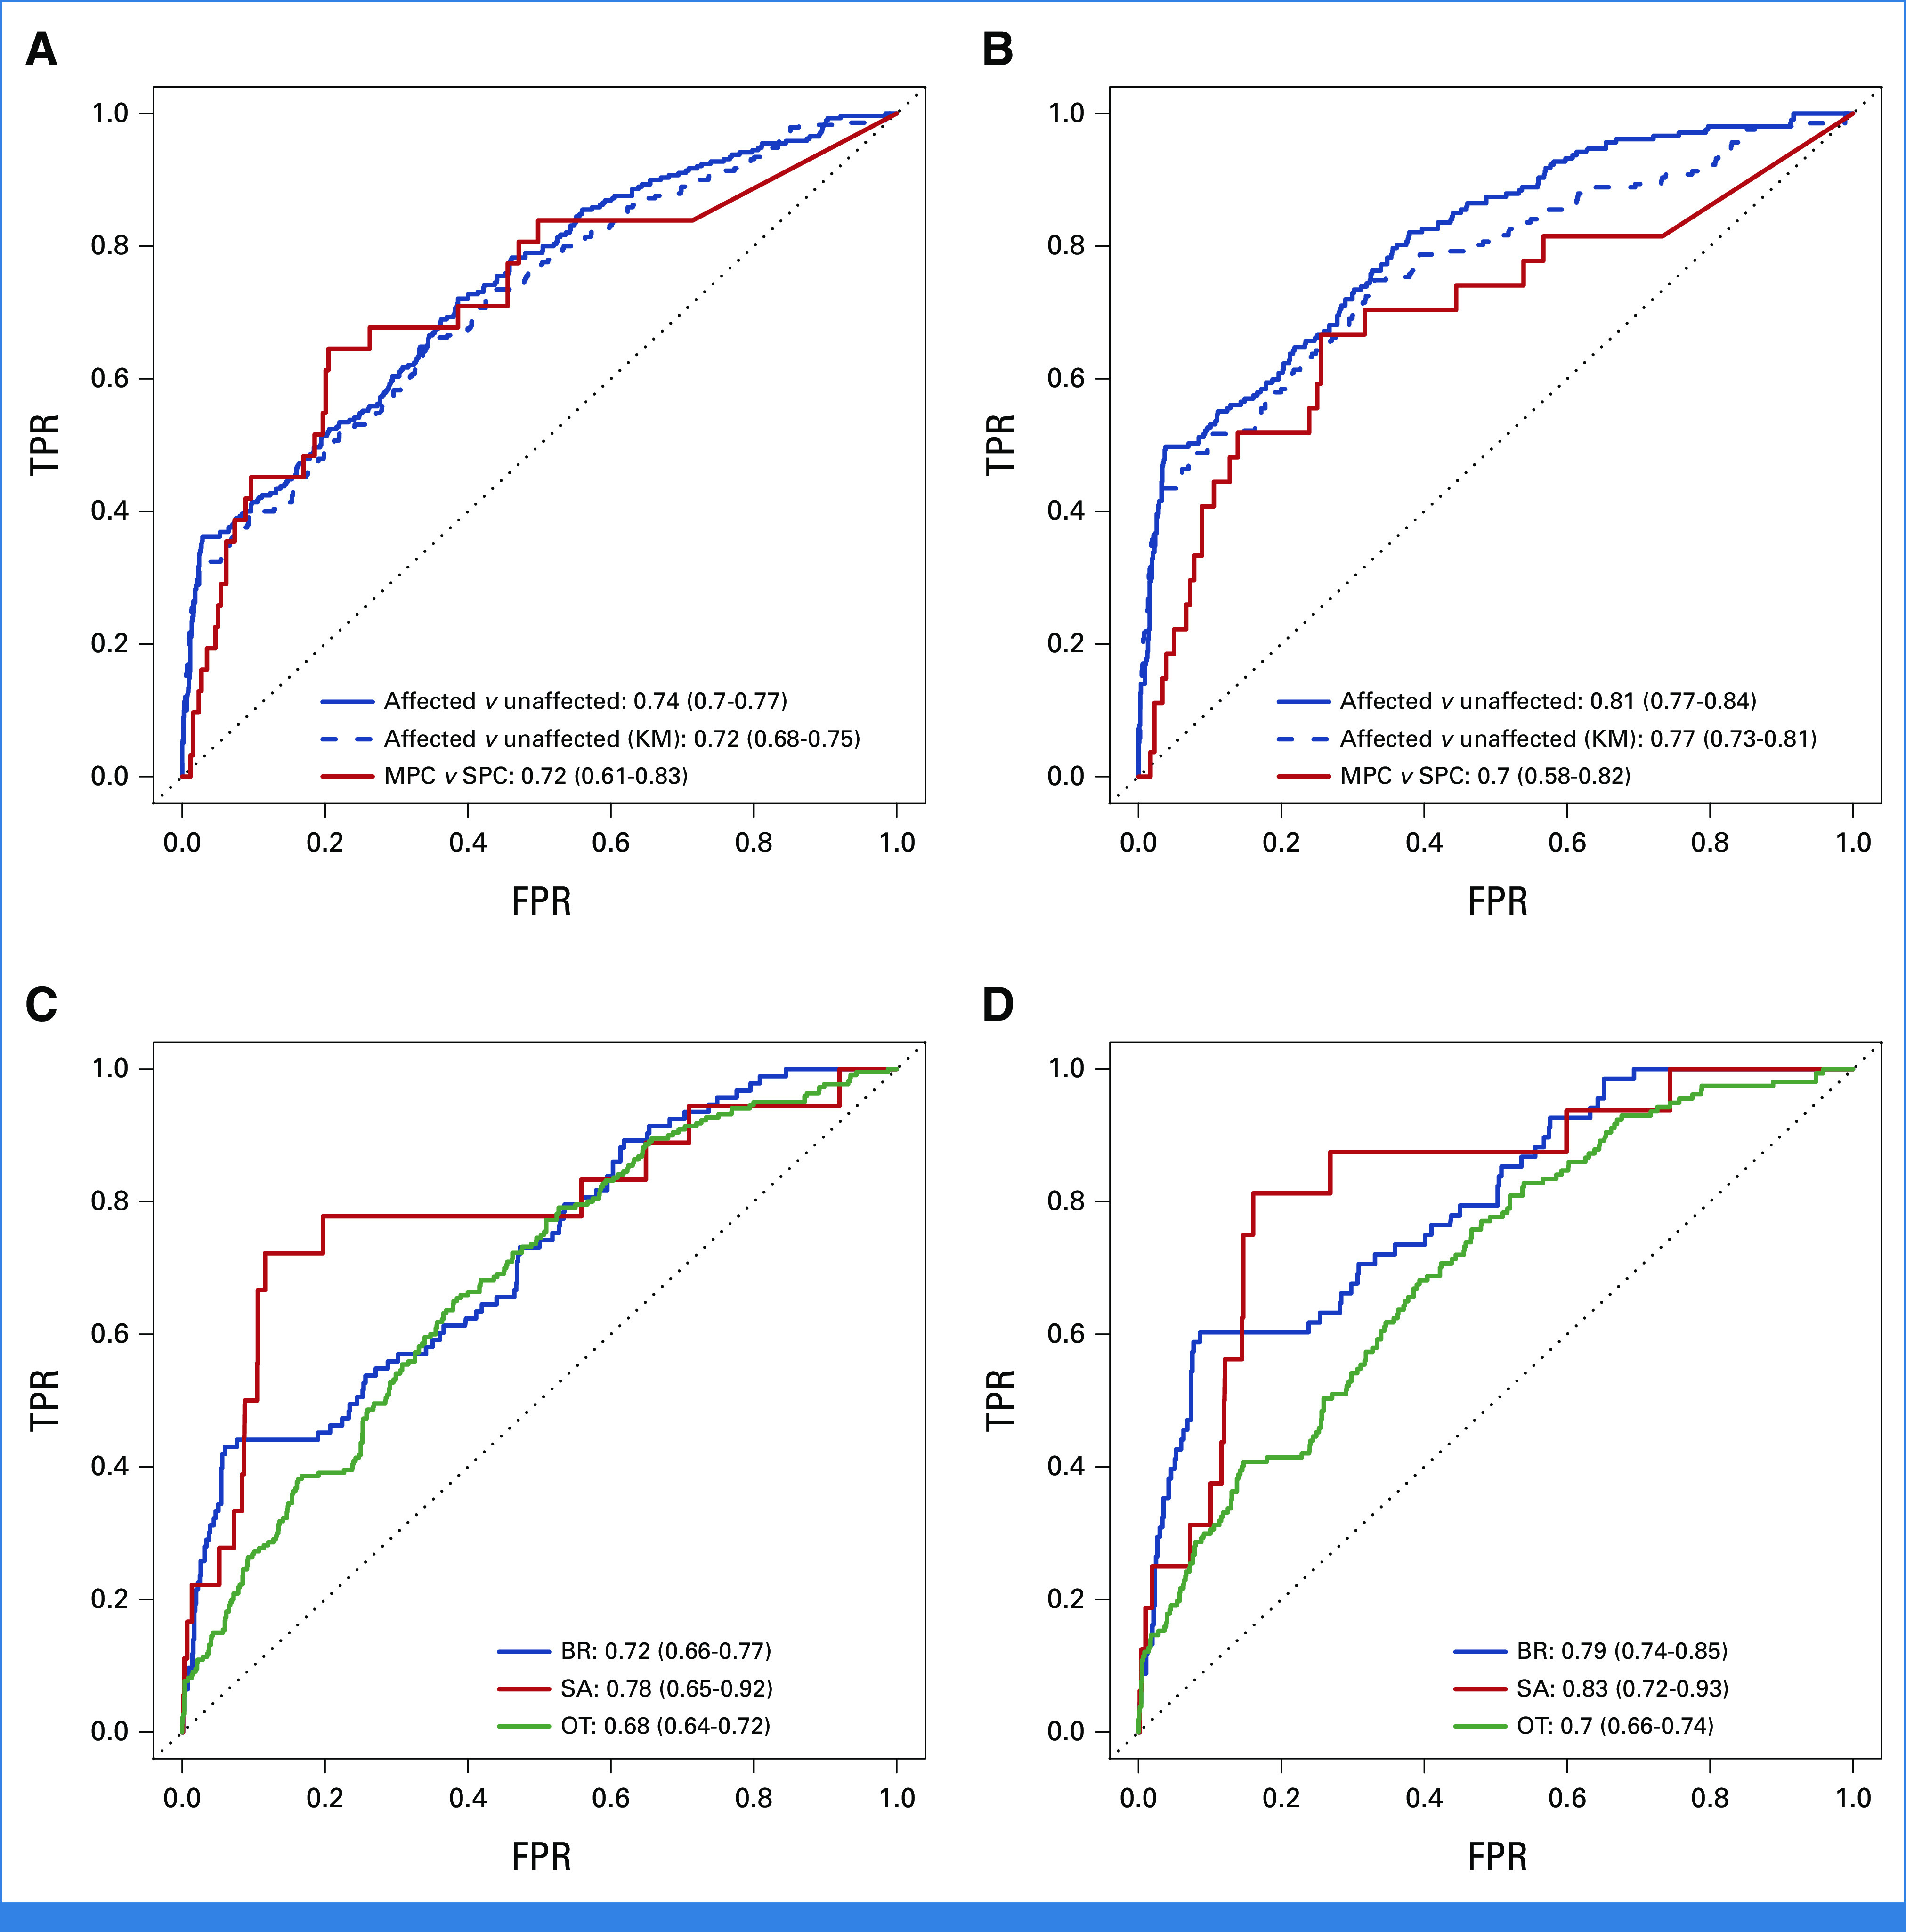
FIG 3.

ROC curves and the 95% bootstrapped CIs of the AUCs for predictive performance of the CS and MPC models on the CCG cohort under two scenarios: (A) and (C) all validation subjects are included and (B) and (D) only known and inferred mutation carriers and wildtypes are included. For comparison, the KM method is used to predict at least one cancer versus no cancer. Sample sizes in scenario (A) and (C): n (unaffected) = 1,264, n (SPC) = 259, n (MPC) = 31, n (BR) = 94, n (SA) = 18, n (OT) = 220, n (D) = 497, n (A) = 879. Sample sizes in scenario (B) and (D): n (unaffected) = 907, n (SPC) = 180, n (MPC) = 27, n (BR) = 69, n (SA) = 16, n (OT) = 157, n (D) = 379, n (A) = 617. A, alive; BR, breast cancer; CCG, Clinical Cancer Genetics; CS, cancer-specific; D, death; FPR, false-positive rate; KM, Kaplan-Meier; MPC, multiple primary cancer; OT, all other cancer types combined; ROC, receiver operating characteristic; SA, sarcoma; SPC, single primary cancer; TPR, true-positive rate.
