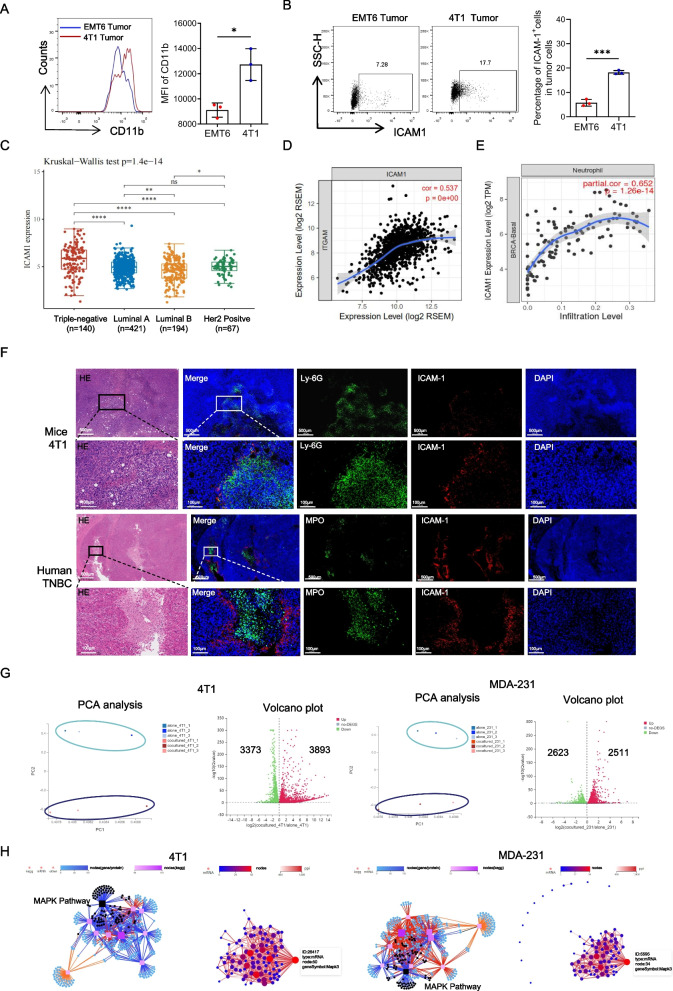
Fig. 4.
Neutrophil CD11b directly binds to the tumor cell ICAM1, facilitating cell adhesion. A Flow analysis of CD11b in tumor infiltrating neutrophils from 4T1 or EMT6 tumor bearing mice at 2 weeks. B Flow analysis of ICAM1 in tumor cells from 4T1 or EMT6 tumor bearing mice at 2 weeks. C Quantitative analysis of ICAM1 expression in primary breast cancer of different molecular subtypes in TCGA database. D Pearson analysis of the correlations between ITGAM (CD11b) expression with ICAM1 expression in primary tumors with breast cancer from the TCGA database. E Pearson analysis of the correlations between ICAM1 expression with neutrophil infiltration in primary tumors with TNBC from the TCGA database. F Representative H&E and paired immunofluorescence staining images of neutrophils and ICAM1 in tumor from 4-week tumor bearing mice and TNBC patient. Red, ICAM1. Green, Ly6G (neutrophil in mice). MPO (neutrophil in human). Blue, DAPI. Scale bar, 500 μm and 100 μm respectively. G Principal component analysis (PCA) (left panel) and Volcano Plot (right panel) of RNA-seq of the tumor cell co-cultured with or without neutrophils. Each dot of Volcano Plot representing a gene and genes significantly upregulated in red and downregulated in green. H KEGG pathway analysis (left) and protein network analysis (right) of RNA-seq of differential gene in tumor cell co-cultured with or without neutrophils. Data are presented as the means ± SD from one representative experiment. Similar results were obtained from three independent experiments, unless indicated otherwise. Statistical analysis was performed by two-tailed unpaired Student's t test (A, B), Kruskal-wallis test (C). ns, not significant, *p˂0.05, **p˂0.01, ***p˂0.001, and ****p˂0.0001

