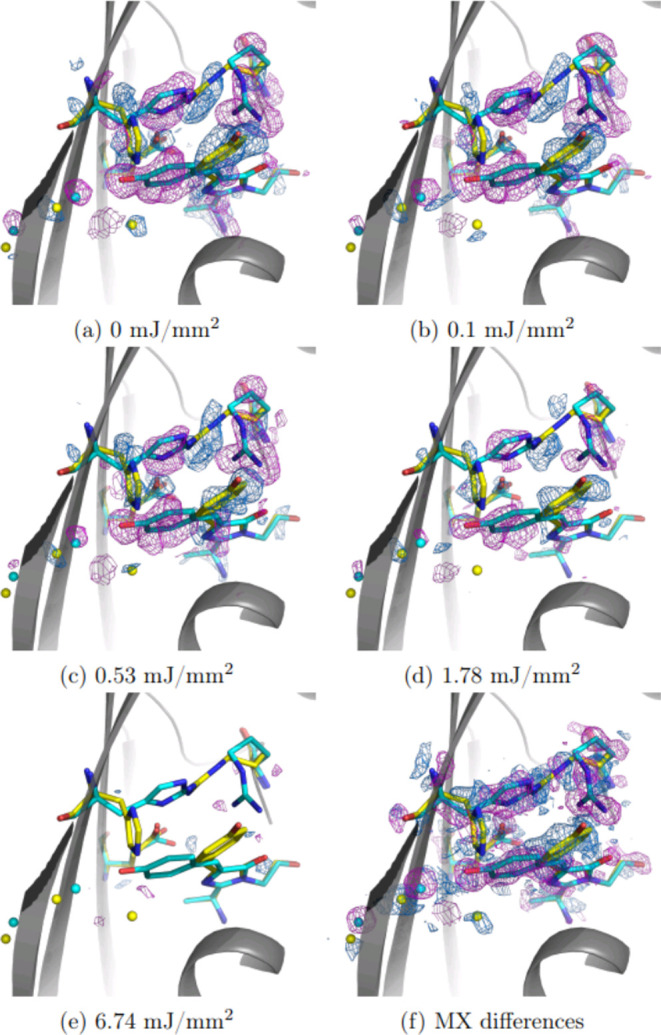
Figure 2.

Power density titration of Trans-to-Cis photoisomerization using 2 ms flashes at 405 nm, following 473 nm continuous wave accumulation of the Trans state. Q-weighted difference electron density relative to the 14.43 mJ/mm2 illumination condition with dominating Cis state is plotted at ±3σ rms (positive in blue, negative is magenta), scaled by resolution bins. Cis coordinates are shown in cyan and Trans in yellow. Panels (a)–(e) show differences from the highest energy density (E = 14.43 mJ/mm2) structure factors: Fobs(E = 14.43) – Fobs(E). For comparison, panel (f) shows the difference of two steady state structures collected using MX reported previously.32
