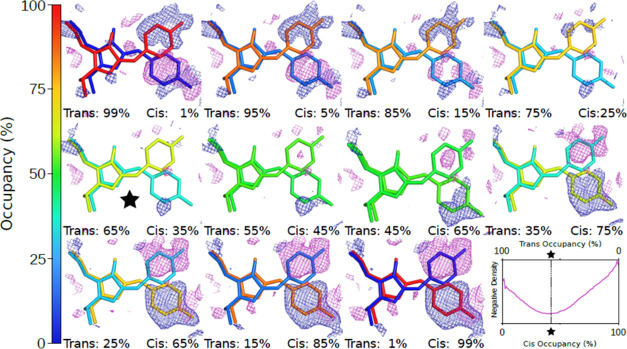
Figure 3.
Difference electron density for 0.53 mJ/mm2 energy density: mFobs (0.53) – nFcalcd (Occupancy). Plotted at ±2.0 rms with negative and positive features in magenta and blue, respectively. The percentage indicates the cis occupancy fraction. In the bottom right, the integrated negative electron density around the chromophore is plotted as a function of the Cis occupancy with the minimum indicated.

