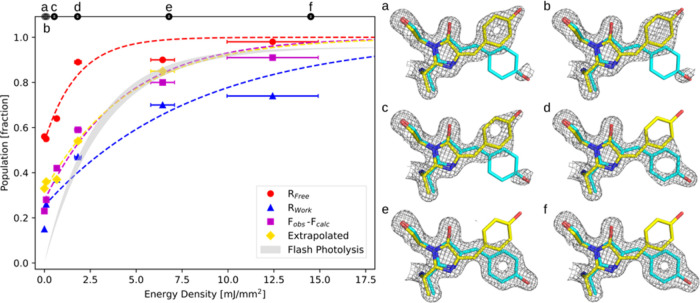
Figure 4.
Left: Population fraction of the Cis state is plotted as a function of energy density state for the different occupancy determination methods. The fluence-based first-order rate constants, k(mm2/mJ) and retrieved temperature jump values are reported for the four different crystallographic quantification methods. Right: (a) (0 mJ/mm2), (b) (0.10 mJ/mm2), (c) (0.53 mJ/mm2), (d) (1.78 mJ/mm2), (e) (6.74 mJ/mm2), (f) (14.43 mJ/mm2) phased electron density maps at 1.5 rms using occupancies determined by minimization of 2Fobs – Fcalcd density with increasing energy density of the 405 nm 2 ms flashes. A clear shift in electron density can be seen toward the photoproduct (Cis state) as the energy density increases. The crystallographic determinations of Cis population at zero energy density were 0.56 ± 0.05 (RFree method), 0.33 ± 0.05 (Fextrapolated), 0.25 ± 0.05 (RWork), and 0.29 ± 0.05 (Fo – Fc).

