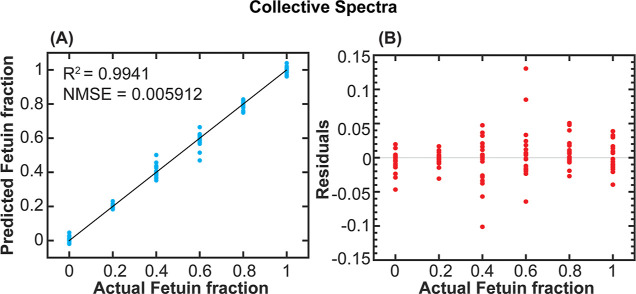
Figure 4.
ML regression for the prediction of sialylation levels of fetuin/asialofetuin mixtures. (A) Predicted fetuin fraction vs actual fetuin fraction and the (B) residual plot (residuals vs actual fetuin fraction). The regression was conducted using the collective spectra (4MBA, 1TBA, 3MBA, 4ABA, and PyriBA). The figure shows the quantitative ability of the sensor and demonstrates the capability of directly detecting glycans on intact glycoproteins.

