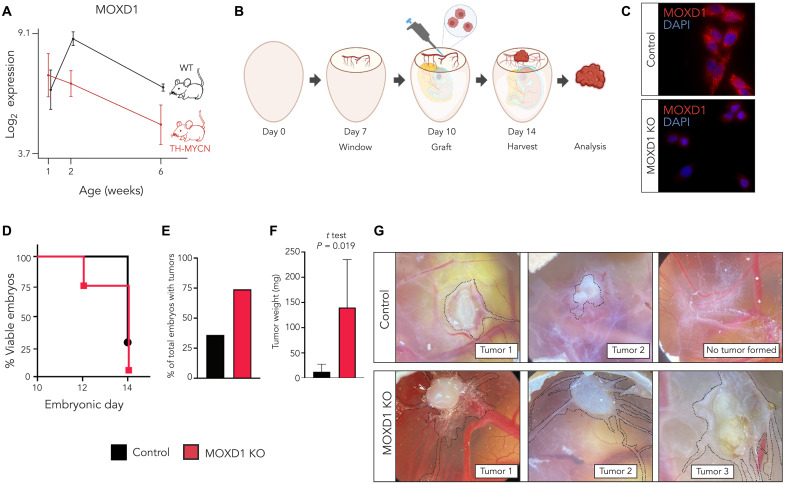
Fig. 3. MOXD1 knockout (KO) in neuroblastoma cells increases tumor formation in vivo.
(A) MOXD1 expression score analysis by RNA-seq [data from De Wyn et al. (2021)] of sympathetic ganglia from TH-MYCN mice (at 6 weeks of age, tumor tissue at the site of sympathetic ganglia was analyzed), and the corresponding sympathetic ganglia from wild type (WT) mice without tumors (n = 4 for each group and time point). The graph shows the mean expression score ± SD. (B) Schematic description of the CAM assay. Created with BioRender.com. (C) Confirmation of CRISPR-Cas9–mediated knockout of MOXD1 at protein level in neuroblastoma SH-EP cells by immunofluorescence. DAPI (4′,6-diamidino-2-phenylindole) was used to counterstain the nuclei. (D) Survival of chick embryos as presented by the percentage of viable embryos at the indicated time points. Eggs implanted with control (CTRL) cells are marked in black and MOXD1 KO in red. Implanted eggs: n = 28 CTRL and n = 38 MOXD1 KO. (E) Number of eggs with detectable tumors as presented by percentage at D14. There are no error bars due to the absolute numbers. Implanted eggs: n = 28 CTRL and n = 38 MOXD1 KO. (F) Weight in milligram (mg) of the dissected tumors. Error bars indicate SEM and P value determined by t test. Note that there are few eggs involved in this analysis due to the high number of dead embryos and spread tumors that could not be completely dissected. Weighed tumors at D14: n = 5 CTRL and n = 2 MOXD1 KO. (G) Representative images of the CAM in the respective group. Tumor area marked by dashed lines.

