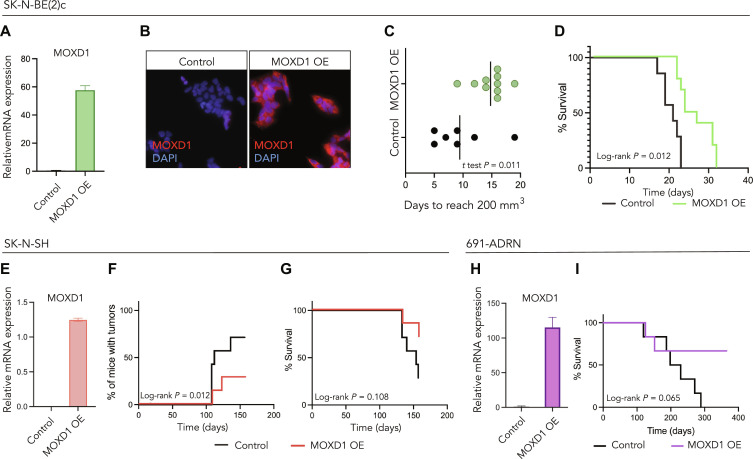
Fig. 5. MOXD1 overexpression in ADRN-like cells prolongs survival and reduces tumor burden in in vivo mouse models.
(A and B) Confirmation of MOXD1 overexpression by lentiviral transduction at the mRNA (A) and protein (B) level in neuroblastoma SK-N-BE(2)c cells by qPCR and immunofluorescence, respectively. DAPI was used to counterstain the nuclei. Error bars denote SD from n = 3 biologically independent repeats. (C) Time to tumor formation in mice subcutaneously injected with SK-N-BE(2)c cells transduced with an empty control vector or an MOXD1 overexpression (OE) vector determined by days to reach a volume of 200 mm3. The line indicates the mean and P value by Student’s t test as indicated (n = 10 in MOXD1 OE and n = 7 in CTRL). (D) Kaplan-Meier plot of the overall survival in mice of the indicated subgroup of SK-N-BE(2)c (n = 10 MOXD1 OE, n = 7 CTRL). P value by the log-rank (Mantel Cox) test as indicated. (E) Confirmation of MOXD1 overexpression by lentiviral transduction at the mRNA level in neuroblastoma SK-N-SH cells by qPCR. Error bars denote SD from n = 3 biologically independent repeats. (F) Percentage of mice with tumors from the indicated subgroup of SK-N-SH cells (n = 7 per group). P value by log-rank (Mantel Cox) test. (G) Kaplan-Meier plot of overall survival in mice of the indicated subgroup of SK-N-SH (n = 7 per group). P value by the log-rank (Mantel Cox) test as indicated. (H) Confirmation of MOXD1 overexpression at the mRNA level in neuroblastoma 691-ADRN cells by qPCR. Error bars denote SD from n = 3 biologically independent repeats. (I) Kaplan-Meier plot of survival in mice of the indicated subgroups of 691-ADRN cells (n = 6 per group). P value by the log-rank (Mantel Cox) test as indicated.

