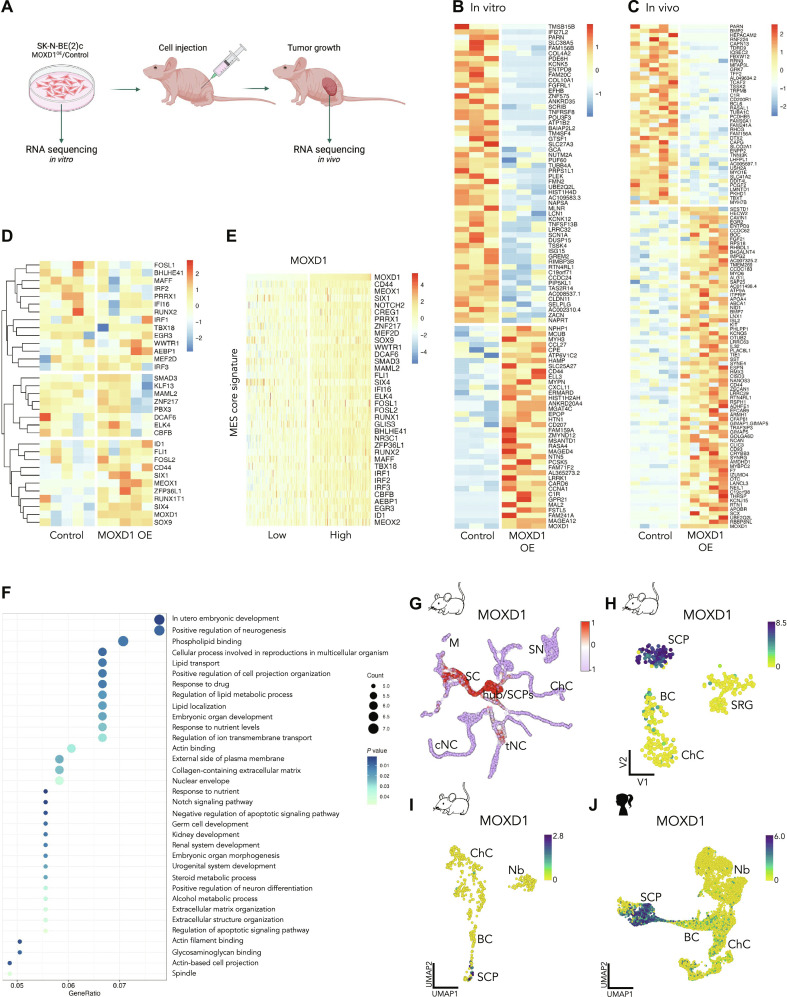
Fig. 6. MOXD1 enriches for pathways associated with embryonic development and its expression is restricted to SCPs.
(A) Schematic illustration of in vitro grown SK-N-BE(2)c cells [MOXD1 overexpression (OE) or control] and in vivo tumors generated from the same in vitro grown SK-N-BE(2)c cells injected subcutaneously, collected for RNA-seq. Created with BioRender.com. (B and C) Heatmaps of the identified DEGs between wild-type (control) and MOXD1 OE SK-N-BE(2)c cells in vitro (B) and in vivo in mice (C). (D) Heatmap with unsupervised clustering analysis of MES core signature genes adapted from Thirant et al. (16) of the samples in (C). (E) Heatmap of MES core signature genes adapted from Thirant et al. (16) of the 25% of neuroblastomas with lowest MOXD1 expression versus the 25% neuroblastomas with highest MOXD1 expression in the SEQC cohort. (F) Gene ontology enrichment analysis of the DEGs in (C). (G) Mapping of MOXD1 expression on single cells from mouse neural crest and Schwann cell linages from Kastriti et al. (28). (H and J) Visualization of MOXD1 by cell-type clustering on a single-cell analysis of (H) mouse neural crest from Furlan et al. (44), (I) developing mouse adrenal medulla from Hanemaaijer et al. (23), and (J) human adrenal lineage from Jansky et al. (24). Color scale shows log2-transformed expression. BC, bridge cells; ChC, chromaffin cells; cNC, cranial neural crest; M, melanocytes; Nb, neuroblast; SC, Schwann cells; SCP, Schwann cell precursors; SN, sympathetic neurons; SRG, suprarenal sympathetic ganglion; tNC, trunk neural crest.

