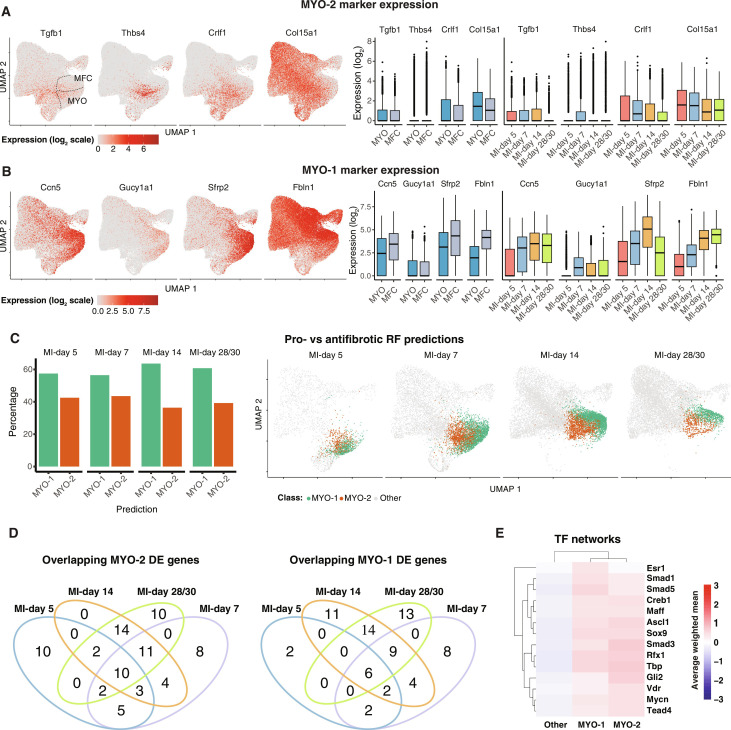
Fig. 3. Profibrotic versus antifibrotic MYOs and MFCs.
(A and B) Expression of marker genes for MYO-2 [(A) profibrotic] or MYO-1 [(B) antifibrotic] on an aggregate UMAP or as visualized in box plots comparing MYO and MFC or an aggregate of MYO and MFC across the relevant MI time points. (C) Percentage of MYO/MFC cells across the indicated MI time points predicted with a RF classifier corresponding to either antifibrotic versus profibrotic subtypes. Shown are the percentage of cells predicted in either category (left) or the location of the predicted pro/antifibrotic cells on UMAP coordinates according to time point (right). (D) Venn diagrams representing flux of MYO-1 and MYO-2 differentially expressed signature genes [MAST testing; Padj < 1 × 10−05; log2(fold change) > 0.5] across treatment conditions. (E) Top 10 predicted TFs for MYO-1 or MYO-2 cells for MI-days 5 to 30 cells. Shown are the average weighted mean decoupleR scores across the cells for each indicated population.

