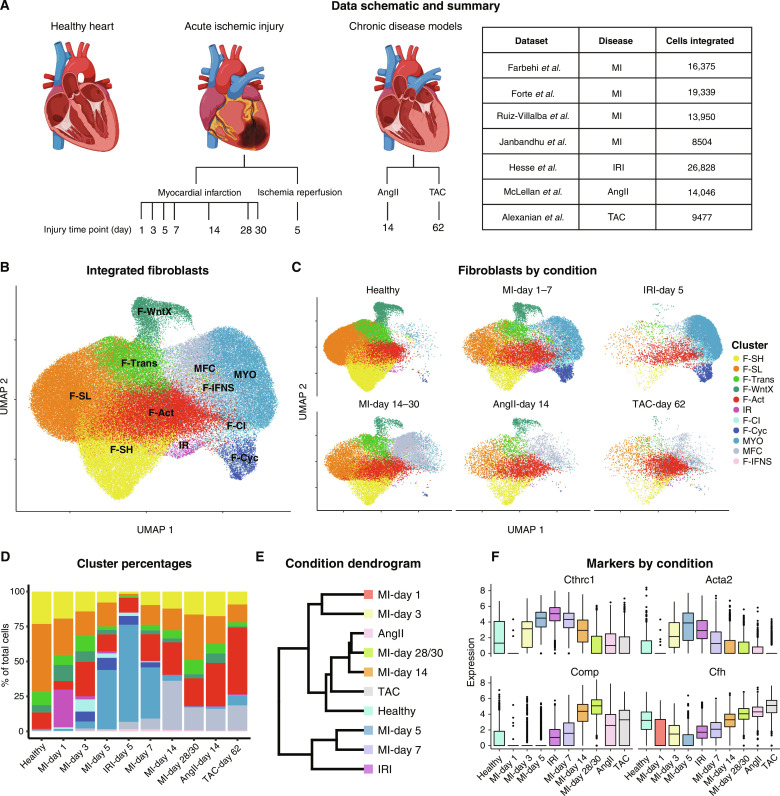
Fig. 4. Cross-disease integration.
(A) Schematic of the disease and time points used for integration and the corresponding studies. (B) UMAP plot showing an aggregate of CFs across conditions. (C) UMAP plot showing CFs according to condition. (D) Percentage of CFs in each population according to experimental condition. (E) Dendrogram of disease conditions determined by average batch-corrected expression in each condition across populations. (F) Expression of select markers according to disease condition.

