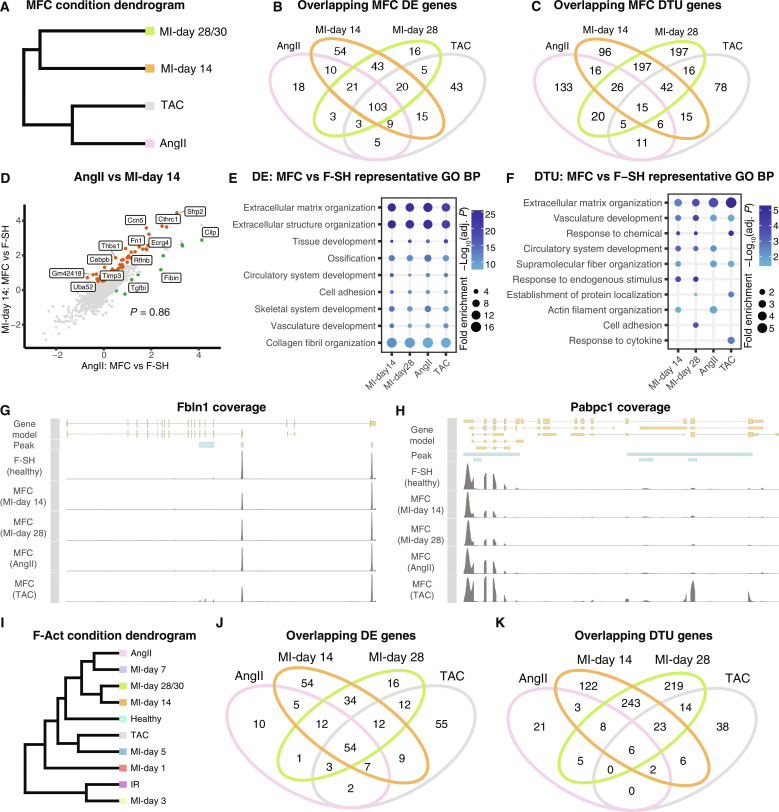
Fig. 6. Cross-disease comparison of MFCs and activated fibroblasts.
(A) Dendrogram of indicated disease conditions determined by average batch-corrected expression in MFCs. (B and C) Overlapping DE [MAST testing; Padj < 1 × 10−05; log2(fold change) > 0.5] (B) and DTU [Sierra; Padj < 0.05; log2(fold change) > 0.5] (C) genes between conditions determined by comparing MFCs to the healthy F-SH cells of the relevant dataset. (D) Comparison of log2(fold changes) comparing MFC to F-SH for AngII and MI-day 14. (E and F) Representative GO BP terms for MFC versus F-SH (E) DE or DTU (F) genes between conditions. (G and H) Read coverage plots for example DTU genes (G) Fbln1 and (H) Pabpc1 with the differential peak indicated. Shown is read coverage for F-SH from a merge of healthy hearts compared to MFC cells from the indicated conditions. (I) Dendrogram of disease conditions determined by average batch-corrected expression in F-Act. (J and K) Overlapping DE (J) and DTU (K) genes between conditions determined by comparing F-Act to the healthy F-SH cells of the relevant dataset.

