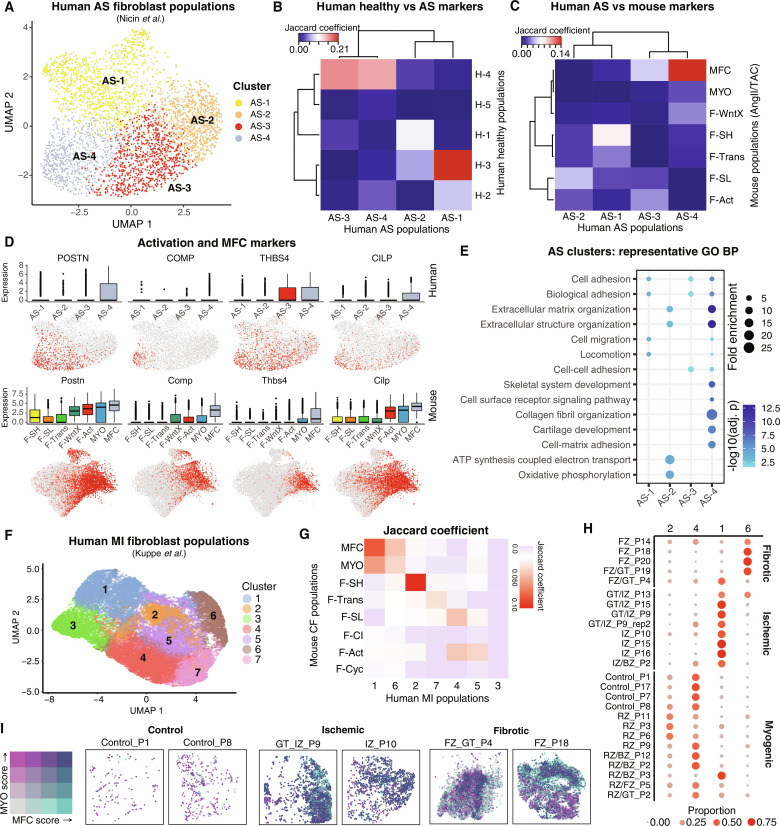
Fig. 9. Analysis of CFs in human hearts from patients with AS and MI.
(A) UMAP of human AS CFs with identified subclusters. (B and C) Jaccard coefficients for (B) the overlap of AS fibroblast population markers with markers from fibroblasts from healthy (H) hearts and (C) the overlap of human and mouse CF marker genes from AngII and TAC hearts [MAST testing; Padj < 1 × 10−05; log2(fold change) > 0.5]. (D) Gene expression as visualized in box and UMAP plots comparing human AS fibroblasts (top) and mouse (bottom) AngII/TAC fibroblasts. (E) Representative GO BP terms overrepresented among AS fibroblast clusters. (F) UMAP of snRNA-seq–resolved human MI fibroblast populations colored by unbiased clusters. (G) Heatmap of Jaccard indices of marker genes for human MI fibroblast population clusters with mouse CF populations. (H) Dot plot displaying relative proportion of human MI fibroblast populations within each patient sample. Color and size of dots corresponds to relative proportion among the four clusters within each patient sample. (I) Spatial coordinates of Visium-resolved human MI samples, colored using bivariate color scheme corresponding to MFC and MYO scores. Only spots corresponding to the majority Fibroblast percentage are displayed. Patient samples are organized by control (left), ischemic (middle), and fibrotic (right).

