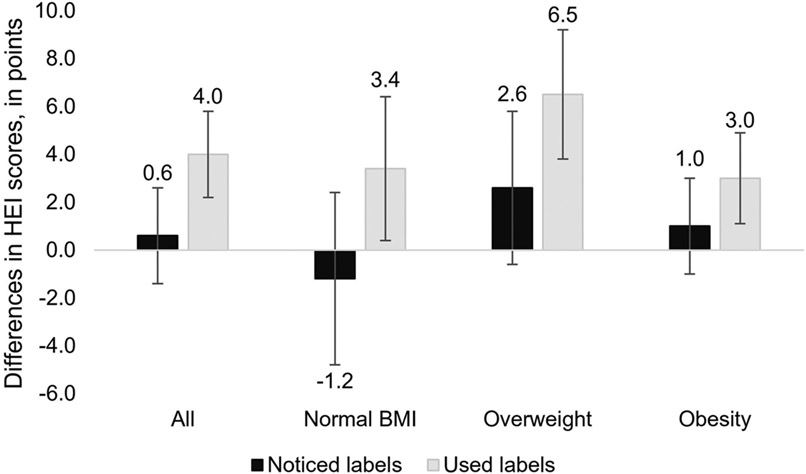
Figure 1.
Adjusted differences in Healthy Eating Index 2015 scores with 95% CIs in noticed labels group and used labels group compared with those who did not notice labels by weight status
Note: Models were adjusted for age, sex, education, family income level, total diet-related comorbidities, smoking, and recreational physical activity. Unadjusted mean HEI-2015 scores in those who did not notice labels were as follows: All 51.3 (SD=1.4), normal BMI 54.1 (SD=2.5), overweight 51.7 (SD=1.9), and obesity 49.3 (SD=1.1).
HEI-2015, Healthy Eating Index 2015.

