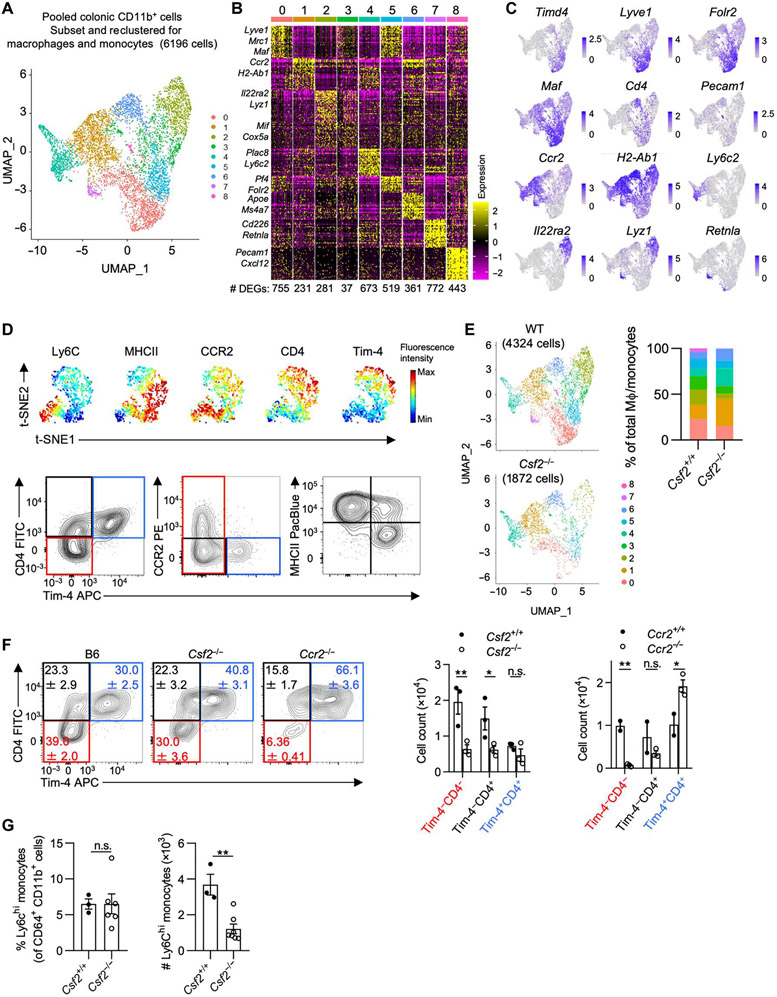
Fig. 1. Developmental requirements and kinetics of colonic LP MΦs.
(A) UMAP projection of the combined analysis of WT and Csf2−/− datasets subsetted and reclustered for MΦs and monocytes visualized together. (B) Heatmap depicting the top 30 DEGs for each cluster (log2FC threshold = 0.25, min.pct = 0.25, adjusted P < 0.05), downsampled to 50 cells for visualization. The number of DEGs in each cluster is shown. (C) Feature plots illustrating expression of subset-defining genes. (D) Representative flow cytometry analysis using (top) unbiased t-distributed stochastic neighbor embedding (t-SNE) dimensionality reduction of colonic CD64+ CD11b+ cells showing expression of common MΦ markers or (bottom) Tim-4/CD4,Tim-4/CCR2, and Tim-4/MHCII classification strategies. (E) UMAP projection (left) of MΦs/monocytes in WT versus Csf2−/− colon with relative abundance of each cluster (right). (F) Contour plots (left) and quantification (right) of colonic MΦs in B6, Csf2−/−, and Ccr2−/− mice. (G) Percentage and absolute counts of Ly6Chi monocytes in WT and Csf2−/− mice. Data shown in (A) to (C) and (E) are from the same scRNA-seq experiment obtained from cells pooled from at least three animals per genotype. Two-way analysis of variance (ANOVA) with post hoc Šidák’s multiple comparisons test (F) or unpaired Student’s t test (G) was performed. FITC, fluorescein isothiocyanate; PE, phycoerythrin; APC, allophycocyanin; n.s., not significant.

