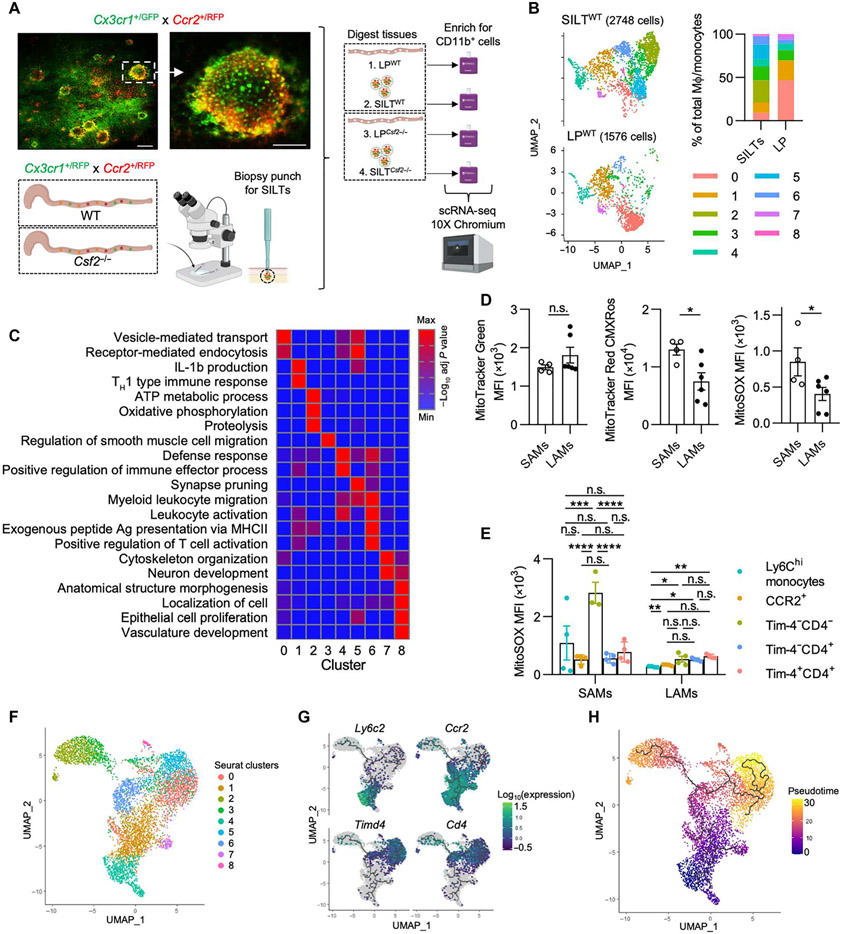
Fig. 5. scRNA-seq analysis of colonic LP MΦs inside and outside SILTs predicts their different functions based on localization.
(A) Representative live images [scale bars, 200 μm (left) and 100 μm (right)] of a colonic SILT in Cx3cr1+/GFP Ccr2+/RFP mice and experimental scheme for scRNA-seq setup. Data are subsetted and reclustered for MΦs and monocytes as in Fig. 1A. (B) UMAP projection of MΦs/monocytes of SILTWT and LPWT (left) with quantification of the relative cluster abundance for each sample (right). (C) Pathway enrichment analysis (gProfiler, GO biological processes) using DEGs for each cluster (from Fig. 1B). (D and E) Colonic SAMs and LAMs were isolated, stained with mitochondrial dyes, and assessed for staining MFI as indicated. TH1, T helper 1. (D) MFIs of mitochondrial dyes in total SAMs and LAMs. (E) MitoSOX MFI of each MΦ population in each colonic region. (F) UMAP dimensionality reduction using Monocle 3 was performed and visualized with overlaid Seurat annotations from Fig. 1A. (G and H) Trajectory analysis was performed using Monocle 3 as indicated by solid black lines. (G) Changes in expression of subset-defining genes were visualized in conjunction with trajectory analysis. (H) Pseudotime analysis was performed and visualized using Monocle 3. Unpaired Student’s t test (D) or one-way ANOVAwith post hoc Tukey’s test (E) was performed.

