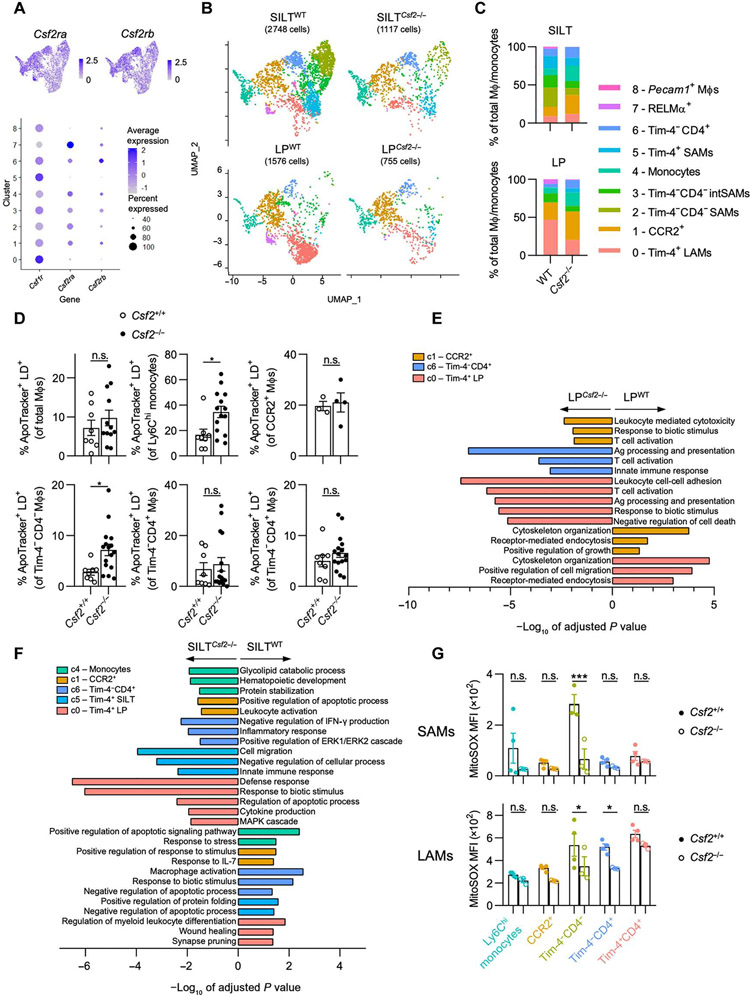
Fig. 6. CSF2 deficiency results in a loss of Tim-4−CD4− SAMs and functional dysregulation of colonic MΦs.
(A) Feature plots (top) and dot plot (bottom) showing expression of Csf1r, Csf2ra, and Csf2rb in each cluster from the merged data. Color denotes expression level, and dot size indicates percentage of cells within the cluster expressing the gene, as indicated. (B) UMAP projection of MΦs/monocytes of each sample. (C) Quantification of the relative abundance of each cluster for each sample. (D) Quantification of apoptotic cells within each colonic MΦ population in sex-matched littermate WT versus Csf2−/− mice by ApoTracker staining, as indicated. (E and F) Pathway enrichment analysis (gProfiler, GO biological processes) using DEGs differentially regulated between WT versus Csf2−/− in (E) LP and (F) SILT for selected clusters, as indicated. Negative values of −log10 of adjusted P value indicate up-regulation in Csf2−/−, and positive values indicate up-regulation in WT. (G) MitoSOX MFI for each SAM population (top) and LAM population (bottom) in sex-matched littermate WT versus Csf2−/− mice. Each SAM data point represents pooled SILTs from two or three mice. Unpaired Student’s t test (D) or two-way ANOVA with post hoc Šidák’s multiple comparisons test (G) was performed. IFN-γ, interferon-γ; MAPK, mitogen-activated protein kinase; ERK1, extracellular signal–regulated kinase 1.

