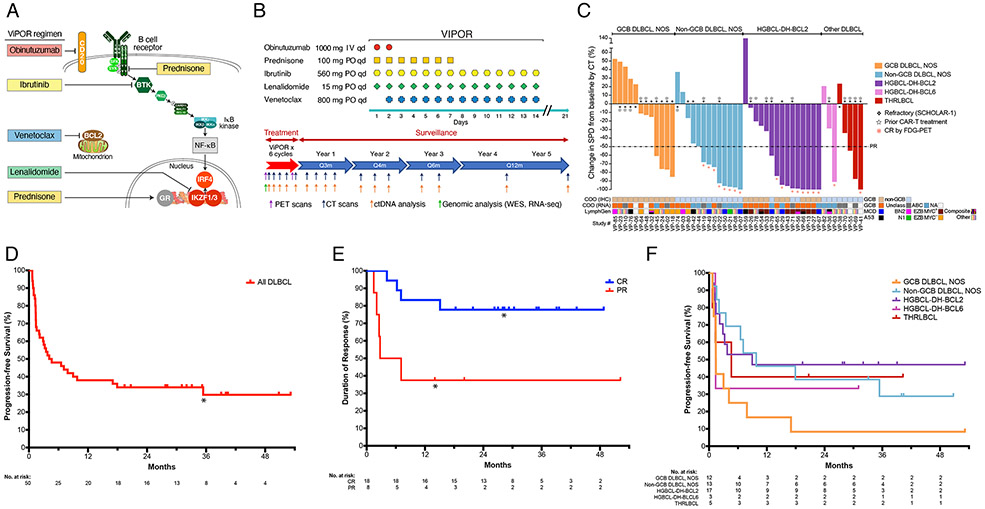
Figure 1: ViPOR Treatment Regimen and Clinical Activity.
A). Schematic of the survival pathways targeted by the ViPOR regimen; B). Schematic of ViPOR agent dosing and post-treatment surveillance monitoring; C). Waterfall plot of DLBCL patients showing the percent change in the sum of the product of the diameters (SPD) following ViPOR therapy as compared to baseline as assessed by computed tomography (CT); D). Kaplan-Meier analysis of progression-free survival starting at the on-study date for all DLBCL patients. *One non-GCB DLBCL, NOS patient died in remission at 31 months from COVID-19 infection; E). Kaplan-Meier analysis of duration of response starting at the response date and separated by complete or partial response to ViPOR. *Two patients (1 in complete response and 1 in partial response) died without disease relapse or progression and were censored at the time of death; F). Kaplan-Meier analysis of progression-free survival starting at the on-study date and separated by histologic DLBCL subtype.

